How to be ahead of your PPC competition? Primarily, you should be armed with data. By analyzing the Auction Insights report, you can get insights into how your ads perform compared to competitors. Keep reading to know how to read this report and apply all that data in practice.
Quick Links
What Is Auction Insights Report and Why Does It Matter?
How to Get the Google’s Auction Insights Report
How to Understand the Auction Insights Metrics and Interpret Them
The Auction Insights Report on Microsoft (Bing) Advertising
How to Apply the Auction Insights [8 Examples]
What Is Auction Insights Report and Why Does It Matter?
Simply put, the Auction insights report showcases your performance on the Paid Search against your competitors. This is an in-built Google’s report to give you a clear vision on how effective your bidding strategy is compared to your competitors’ strategies and what measures you should take to increase your positions and audience reach.
With the Auction Insights report, you can get answers to the following questions:
- Who are your competitors at the auctions you’ve taken part in a given period?
- What advertisers move ahead of you on the Paid Search?
- How strong is the competitiveness between you and other advertisers?
- What are your ads positions compared to other advertisers’ ads?
- Who is targeting your brand name?
Google Auction Insights report is available for the Search and Shopping campaigns (only Search Network). For Search campaigns, you can view this report at the Account, Campaign, Ad Group, and the Keyword level; for Shopping campaigns, the report is not available at the Keyword level.
How to Get the Google’s Auction Insights Report
There are various options to dig into Auction Insights. All of them are viable and display the relevant data, so you can choose the most convenient option for you.
Auction Insights report on the Google Ads workspace
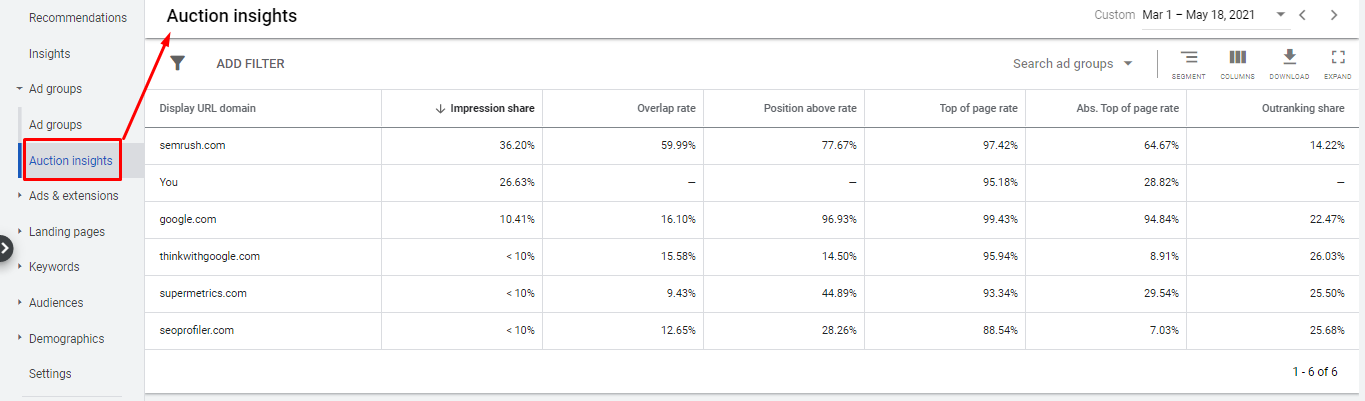
This is a quick way to dive into Auction Insights. To access the report, sign into your Google Ads account and head to the Campaign, Ad Group, or Keywords section, depending on what data you need.
If you want to run a report at the account level (for all campaigns), open the Auction Insights report from the Campaigns section. If you need the stats on specific campaigns, choose the campaign, and open the report from the Ad Group section. The same rule is applicable at the deeper levels.
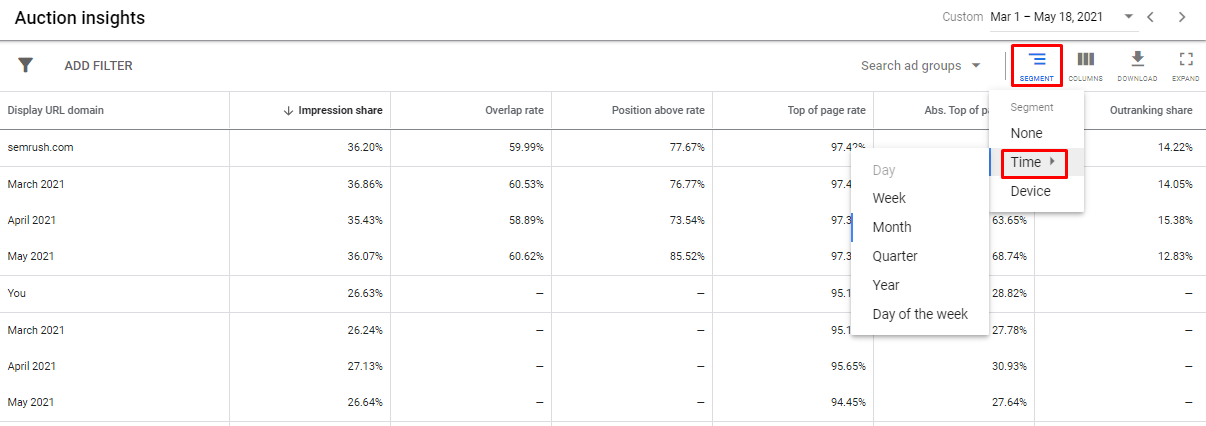
To track the changes in the auction performance, you can segment each report by time (day, week, month, quarter, year, and the day of week).
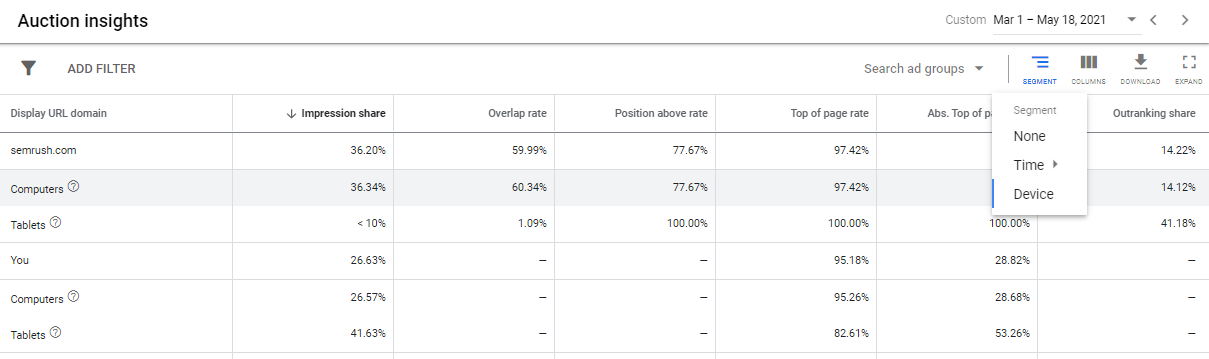
Segmenting by device is available as well.
You can modify columns for Auction Insights. However, in most cases, it doesn’t make sense because all the data displayed by default is essential for competitor analysis.
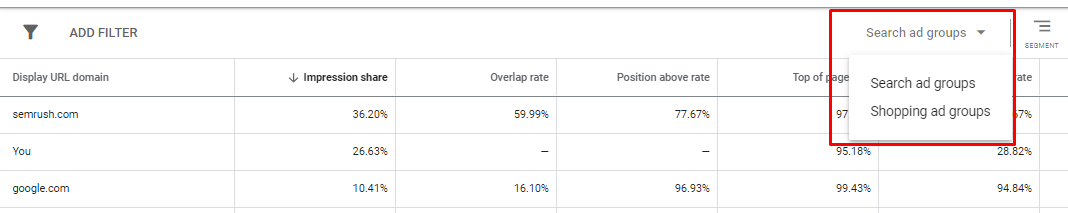
If you open the mixed campaigns reports, you can notice the radio button that allows switching between Search and Shopping ad groups.
To filter out the stats in the table, click the Filter icon, choose the metric, and enter the filtering condition. For example, you can filter out domains with Impression Share above 70%.
50+ PPC Automation Tools [The Most Comprehensive Compilation]
Auction Insights report on the Google’s Report Editor
If you need a more flexible reporting option than the previous one, you should embrace Report Editor. You can choose from predefined reports or create your own.
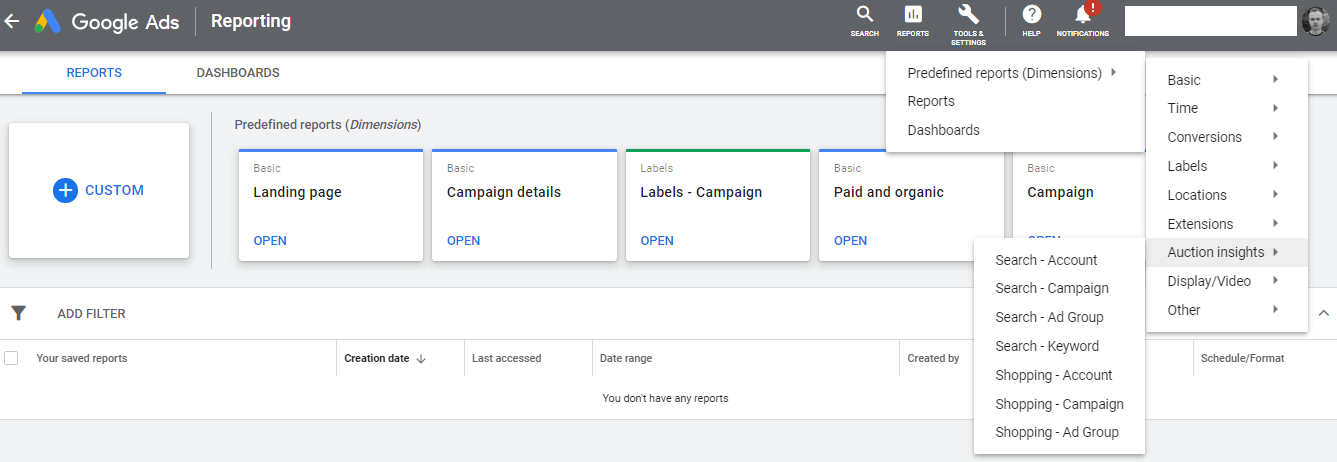
To access the Auction Insights report, click on the Reports icon, and navigate to Predefined reports (Dimensions). From the Auction Insights tab, choose one of the predefined reports for your Search or Shopping ads.
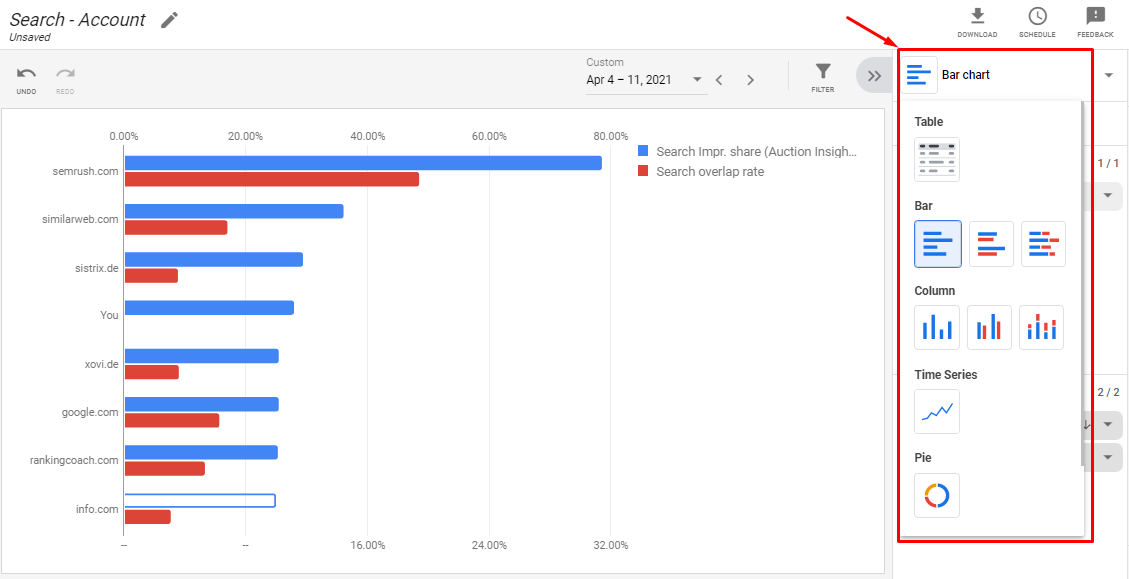
For example, the Search – Account report looks like this:
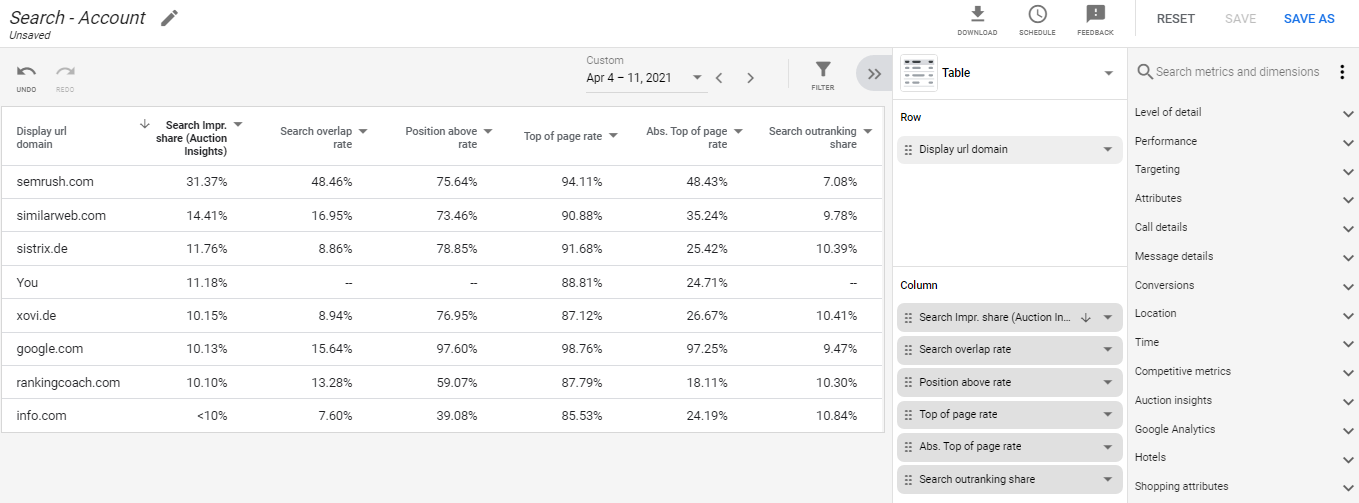
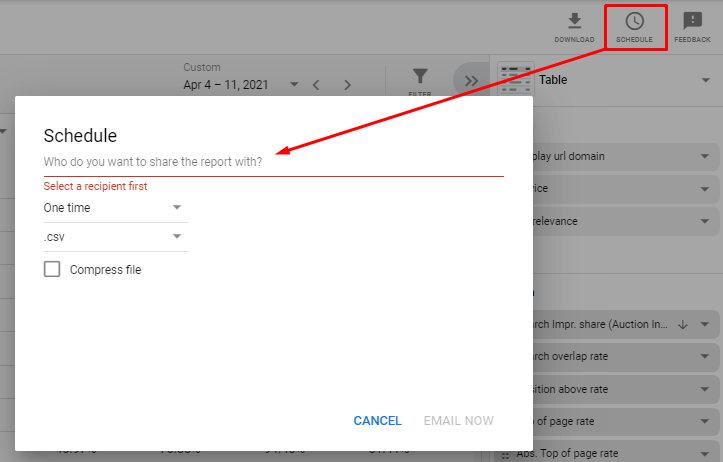
You can customize columns, change the date range, and segment the data by different attributes. There is a scheduling option as well—you can enter the recipient’s email, and he’ll receive the report copy due to the schedule.
Using Report Editor, you can visualize your Auction Insights data. You can choose the way stats are displayed—bar and column charts, time series, and pie charts are available for you.
Auction Insights report templates for Google Data Studio
As an alternative or addition to Google Ads reports, you can leverage Auction Insights report templates for Google Data Studio.
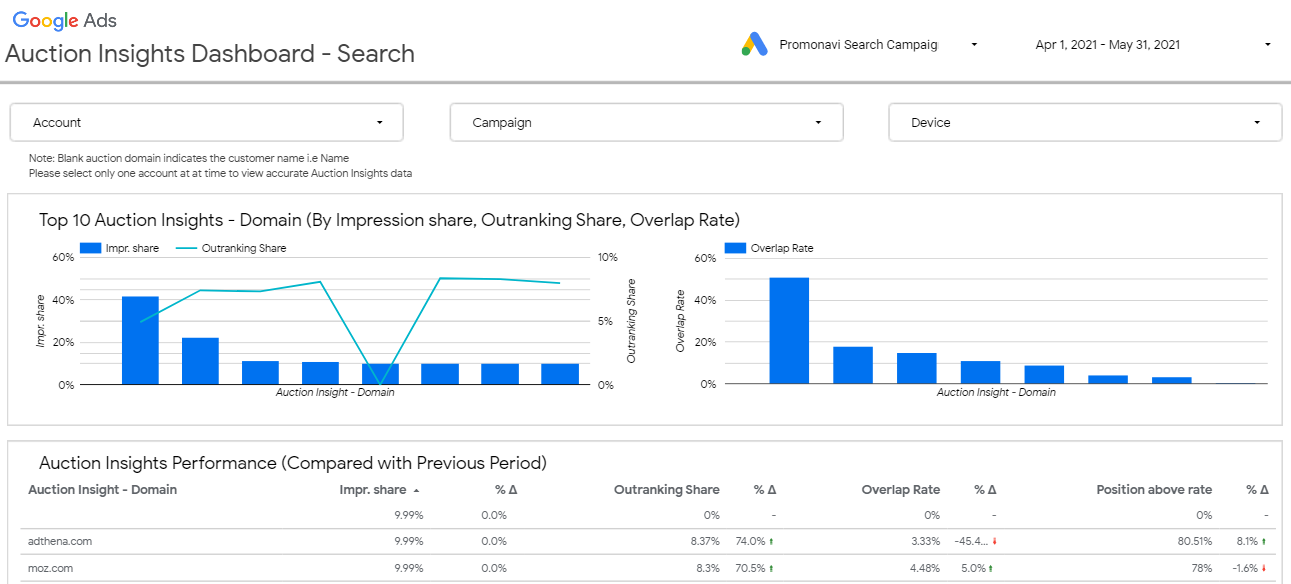
For example, here is an Auction Insights Dashboard — Search template provided by Google. This 1-page template displays the Top 10 Auction Insights across domains. In the table below the charts, there is an Auction Insights performance stats compared to the previous period.
If you run Shopping campaigns, you should embrace another report template created especially for this campaign type.
If you need more granulated Auction Insights stats, you can make use of PromoNavi’s 16-page report template for GDS. For your convenience, all the metric values are visualized on the charts, so you can quickly dig into Auction Insights to refine your bid strategy. Besides, this report provides you with comprehensive stats on your campaign performance, so you don’t need to shift between scattered templates or reporting tools.
Need more PPC reporting templates? Here is a great compilation of 15 report templates for Google Data Studio.
Getting Auction Insights within PromoNavi’s Competitor Analysis tool
Auction Insights is a part of competitor analysis. Hence, it is convenient for you to get all the insights on your competitors, including Auction Insights, within a single place. You can handle this issue using PromoNavi’s Competitor Analysis tool.
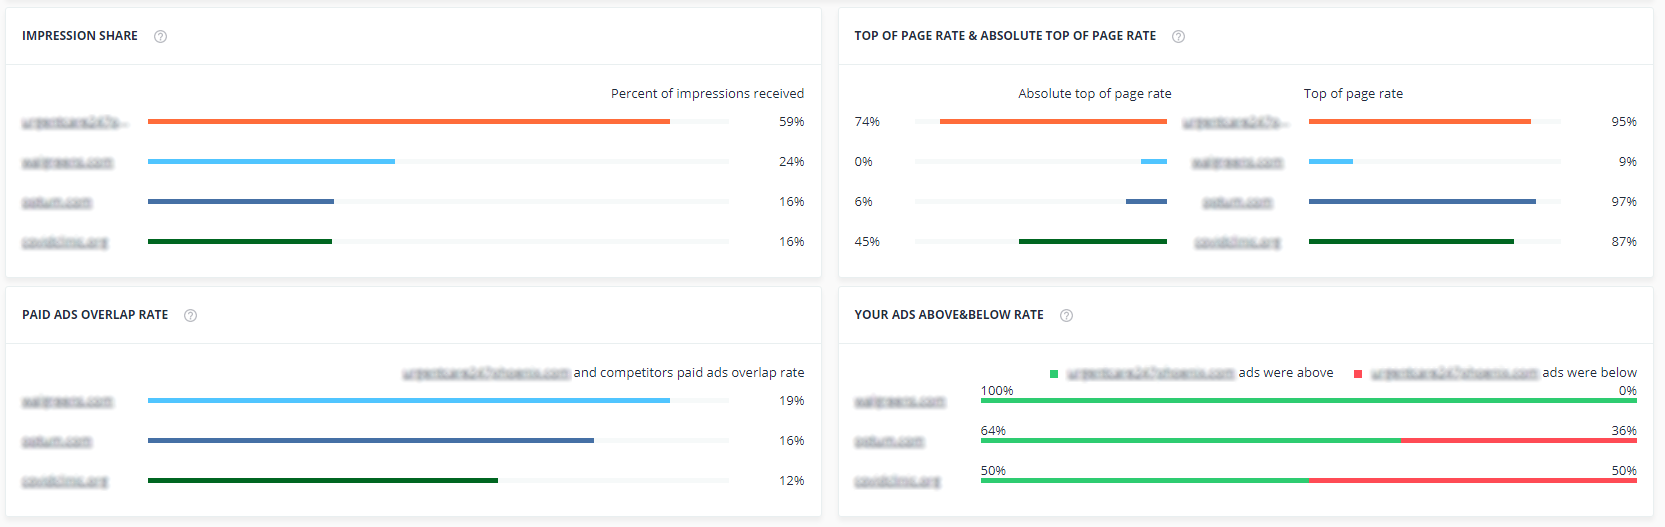
To get started, you should sign in to PromoNavi, link your Google Ads account, and navigate to the Competitor Analysis section. Enter up to 3 competitors, choose the location, and run analysis. In the Auction Insights section, you will find the key metrics, clearly visualized on the charts.
Besides Auction Insights, the Competitor Analysis tool provides you with other essential data: competitors’ Paid Search strategies, performance changes, competitors keywords and ad copies, etc.
Want to try the Competitor Analysis tool and other PromoNavi automation tools? A 14-day free trial with unlimited access to all the features is available for you!
Auction Insights script
This is a solution for those who are not looking for easy ways. However, the report generated by the script is rather granular. The key pinpoint is that you can filter out the data by competitors and include additional metrics, such as CPC, CTR, etc.
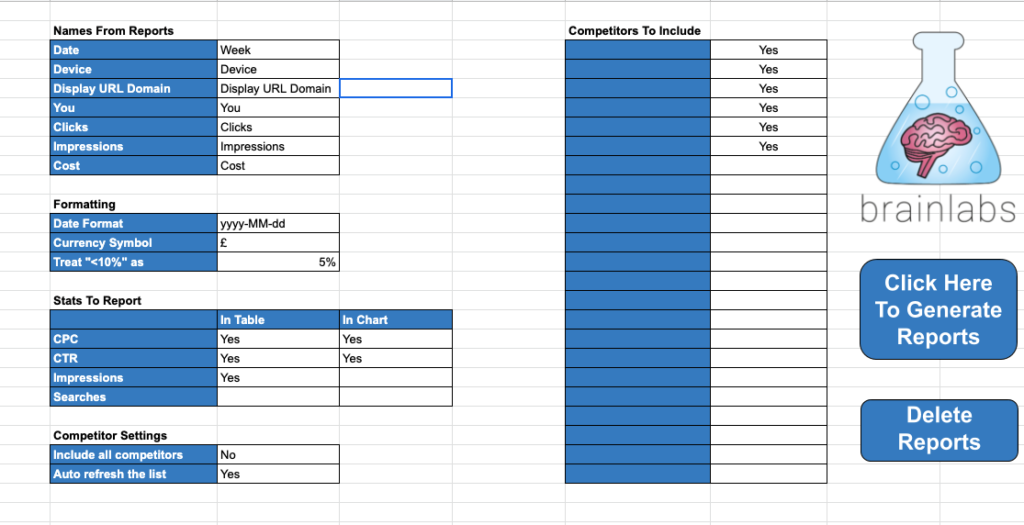
To leverage this report, you should make a copy of the provided spreadsheet. (The script is already integrated into this spreadsheet.) Once done, you should go to your Google Ads account, download the Auction Insights report, and paste the data into the spreadsheet.
You can find the detailed instructions on how to use this report and the link to the spreadsheet here.
How to Understand the Auction Insights Metrics and Interpret Them
For Google Search campaigns, the Auction Insights report includes six metrics:
- Impression share
- Overlap rate
- Position above rate
- Top of page rate
- Absolute Top of page rate
- Outranking share
For Shopping campaigns, only three metrics are available:
- Impression share
- Overlap rate
- Outranking share
Below, we explain what all these metrics mean and how to understand them.
Impression share
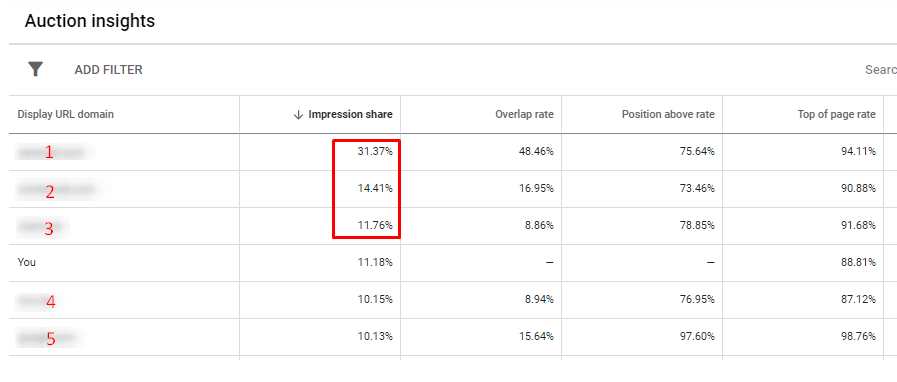
This metric is one of the most important for understanding how you perform on the Search. It is calculated as the number of impressions you received divided by the estimated number of impressions you were eligible to receive. The eligibility depends on your targeting settings, the number of approved ads, and Quality Scores.
From the table below, we can see that competitor 1 has the highest Impression share of 31.37%. That means that his ads were shown 1 out of 3 times in the auctions in which we were both eligible to show. For comparison, our ads appeared only 1 out of 10 times.
Overlap rate
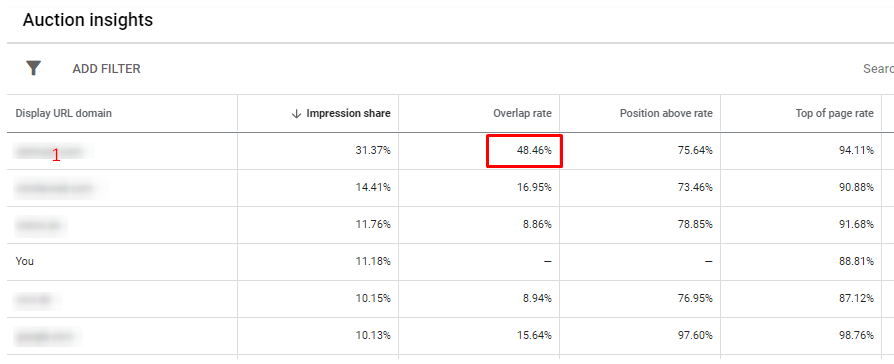
This metric shows the level of competitiveness between you and other advertisers. Overlap rate showcases how often your competitor’s ad received an impression when your ad also received an impression at the same auction.
For example, competitor 1 has the highest Overlap rate of 48.46%. This means that in 1 out of every 2 times our ad showed, an ad from advertiser 1 showed as well. Hence, he has more similar campaigns settings to ours than other advertisers.
Position above rate
Unlike previous metrics, this one gives us an understanding of where competitor ads are showing up compared to our ads.
For example, the Position above rate of 75.64% means that the advertiser ad in 75.64% of auctions was shown in a higher position than ours was when both of our ads were shown at the same time.
The higher Position above rate is, the more aggressive the bidding strategy the competitor uses. If you want to overtake the exact competitor at the same auctions and decrease his Position above rate, you should increase bids.
Top of page rate
This metric shows how often your or your competitor’s ads were shown above the organic search results (positions 1-4 on the SERP).
For example, the Top of page rate of 94.11% means that the advertiser had 10,000 impressions out of which 9,411 impressions appear in any of the positions above the organic search results.
Low Top of page rate means that your ads underperform. The solution might lay in increasing Quality Score and bids.
Absolute Top of page rate
This metrics showcases how often your ads appeared on the very first position on the search result page.
For example, the Abs. Top of page rate of 25% means that the advertiser had 100 impressions out of which 25 impressions appear on the top line of the SERP.
Outranking share
Outranking means that your ad is shown higher than your competitor’s ads, or it appears while your competitor’s ad doesn’t show. The higher Outranking share means that your bidding strategy is more effective than your competitor’s one.
The Auction Insights Report on Microsoft (Bing) Advertising
Bing’s Auction Insights report is almost similar to Google’s one. However, there are few differences:
- On Bing, you can see the Auction Insights reports only from the main menu. There are no Auction Insights stats on the Reports section.
- On Bing, instead of Abs. Top of page rate, you can see another metric—Average position. Positions 1-4 appear at the top of the search results page and positions 5-10 appear in other locations.
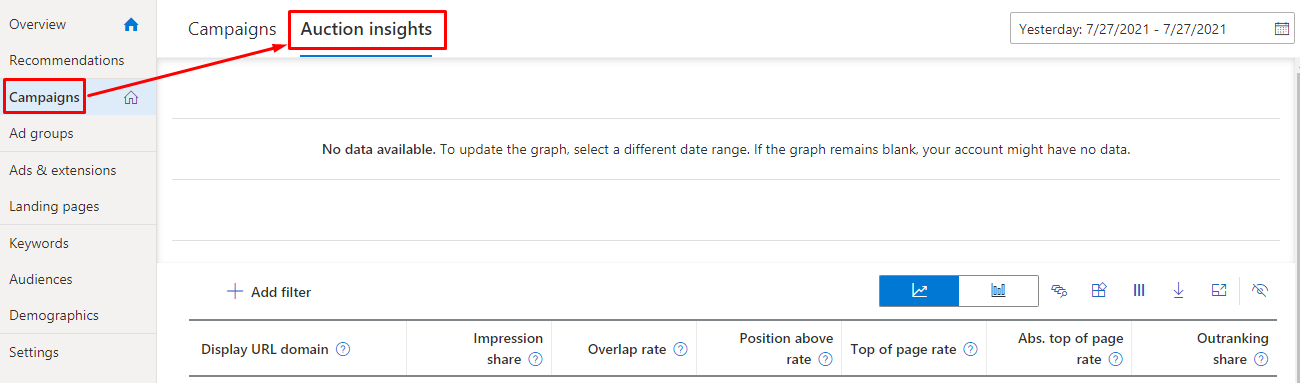
To access Bing’s Auction Insights report, navigate to Campaigns, Ad Groups, or Keywords section. Once done, go to the Auction Insights tab to see the stats.
If your campaign is new or hasn’t got enough impressions yet, the report will be empty. In this case, you should wait for a couple of days or enlarge the reporting period.
How to Apply the Auction Insights [8 Examples]
Now you know what the Auction Insights report is, how to find it on Google and Bing, and what all those metrics mean. It’s time for some practice—below, there are 9 examples of applying the Auction Insights to boost your PPC performance.
Find out who are your competitors on Paid Search
Of course, you know the main competitors for your business. However, the Auction Insights report gives you a clear vision of who is targeting the same keywords as you are.
From this report, you can find new competitors you’ve never heard of before; at the same time, your most considerable competitors might not be as active in PPC advertising as you might suppose.
Also, you can find that some advertisers work in a niche not related to yours—this is the case when you should revise your target keywords to cut off the irrelevant ones.
Discover who is bidding on your brand name
If you have a separate brand campaign, you can look through Auction Insights to find who is targeting your brand name.
Once you uncover the most significant competitors, you can take measures to leave them behind. For brand search campaigns, make sure your Abs. Top of page rate is high—especially in the niches where users make the choice without long walks through the SERP (taxi services, food delivery, etc.)
Adjust bids to overtake your competitors
If you see that your Impression share is too low compared to other advertisers, you should take measures: change targeting settings, check the approval status of your ads, and improve Quality Score. However, all these measures might not be as successful as increasing your bid. In most cases, the latter action is most significant.
Leverage the Auction Insights to make the most of your Smart Bidding
Impression share is an essential indicator for choosing the Smart Bidding strategy. For example, if your Impression share exceeds 75%, it is not recommended to enable tROAS/tCPA strategies, because your campaign doesn’t have headroom for growth. If your Impression share is higher than 75%, you should change the match type of the best performing keywords to Broad Match or expand your keyword list. However, for the Target impression share strategy, your actual Impression share may exceed 75%.
Compare Google Ads and Microsoft Advertising performance
If you compare Google and Bing Auction Insights for the same keywords, you will find that the data vary, sometimes significantly. For example, some advertisers can spend more on Google, and some of them might not show ads on Microsoft at all. Hence, diving into reports from both platforms will give you more insights and help you uncover growth points.
Get to know how shifts in your PPC strategy affects your performance compared to competitors
Tracking Auction Insights by days or weeks allows you to understand whether changes in your bidding strategy or other campaign settings result in better PPC performance. If you don’t notice any changes, maybe your measures were not enough, and you should make more aggressive changes.
Find the less competitive niches
When analyzing the Auction Insights stats, you can notice that some ad groups or keywords show better performance. You can scale your advertising activity in such niches to drive more conversions at a lower cost.
Discover the most competitive devices
You can segment the Auction Insights data by device to figure out which of them performs better. For instance, you can find that your ads on mobile have a lower Impression share compared to PCs; by adjusting bids for mobiles, you can increase your audience reach.
Discover when your competitors are most active
You can display the stats by the day of the week to see if your competitors adjust bids according to any schedule. If you find any repeating patterns, you can create your own bid adjustment schedule to compete with other advertisers effectively.
Final Thoughts
If you didn’t monitor the Auction Insights report on a regular basis, consider leveraging this data to uncover your main competitors and their PPC strategies. However, Auction Insights are only a part of the comprehensive competitor analysis. To dive into more competitor insights, make use of PromoNavi’s Competitor Analysis tool.

![Make Sure Your PPC Strategy is Ready for the Holiday Season [12 Things to Check]](https://blog.promonavigator.com/wp-content/uploads/2021/12/ppc-holiday-600-360.jpg)