Understanding and considering emerging trends means that you can suggest to your customers exactly what they need right now and adapt your business to the future changes in demand.
Google Trends is the most accessible way to uncover search trends in your niche. With its help, you can discover changing the popularity of specific topics, compare the search volume for different segments and regions, and identify seasonality—these and other features are available in Google Trends.
Let’s figure out how to use Google Trends for reaching your business goals.
Quick links:
What is Google Trends and How to Get Started?
The key features of the Google Trends home page
Quick start: how to find popularity of the search term
Google Trends vs Keyword Planner: what is the difference?
How to Read and Understand Google Trends Stats
How to Use Google Trends in Real Practice: 9 Examples
Example #1: Identify seasonal keyword trends
Example #2: Discover the popularity of a query by region
Example #3: Find new keyword ideas
Example #4: Analyse your competitors with Google Trends
Example #5: Find the best wording for high-frequency keywords
Example #6: Find the most popular product in the product range
Example #7: Analyze YouTube trends
Example #8: Discover a burning topic for an article or a social media post
Example #9: Look into popular topics for a specific year
How to Make Your Google Trends Search More Precise
Specify the request by category
Consider the difference between a search term and a topic
What is Google Trends and How to Get Started?
Google Trends is a free platform that shows how interest in the topic or search query changes across countries, subregions, user categories, and search types (Web, Image, News, Google Shopping, or YouTube).
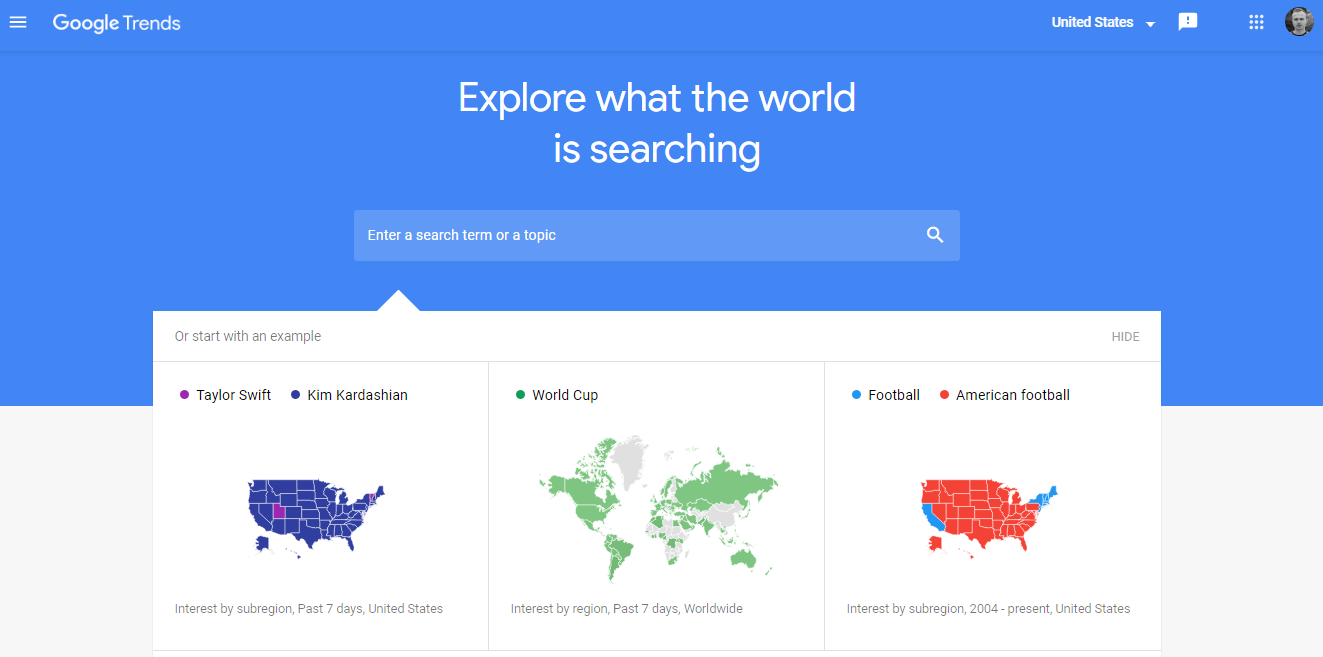
The main features are available on the Google Trends home page. You don’t need to sign up for Google Trends—just follow the link, and you can start using this tool.
The key features of the Google Trends home page
On the first screen, you can see:
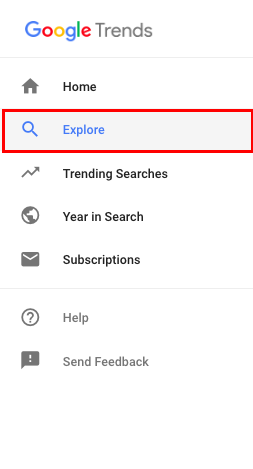
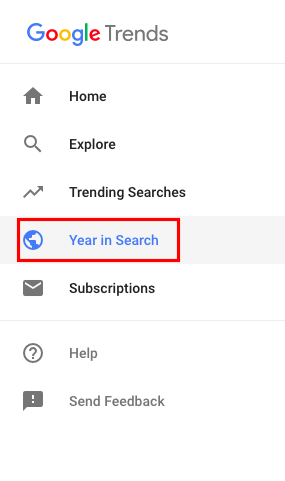
- A hamburger menu with links to the sections: “Home,” “Explore,” “Trending Searches,” “Year in Search,” “Subscriptions.”
- A drop-down menu with country selection.
- A link to the feedback form.
- A search bar.
- Default reports.
Here are examples of default reports:
If a template suits you, click on it, go to the “Explore,” and enter the search terms or topics.
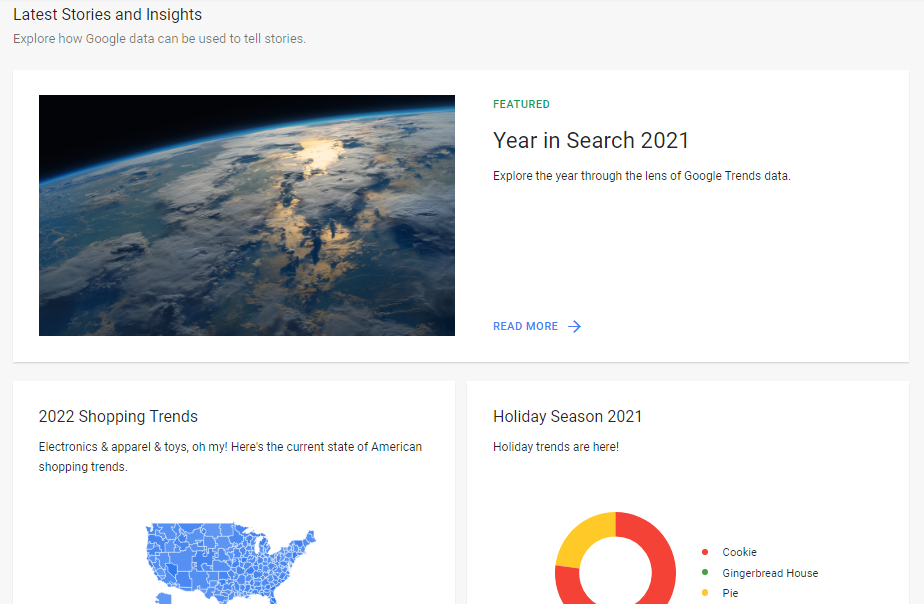
The following section shows the most popular topic (or topics) in the search region. To get detailed statistics on the topic, click on the “Read more” link.
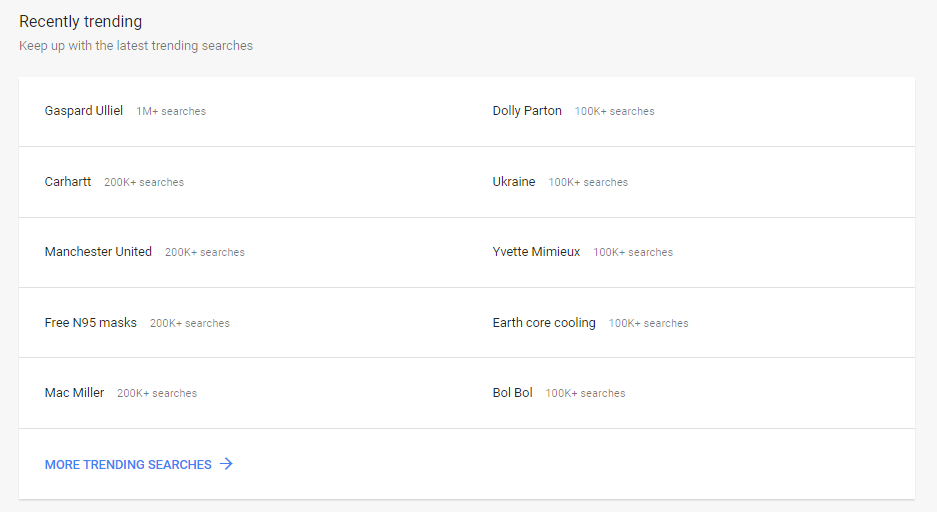
The next section covers current topics that have been gaining popularity over the past 24 hours. By clicking on the “More trending searches” link, you will be redirected to the “Daily search trends” section with advanced statistics:
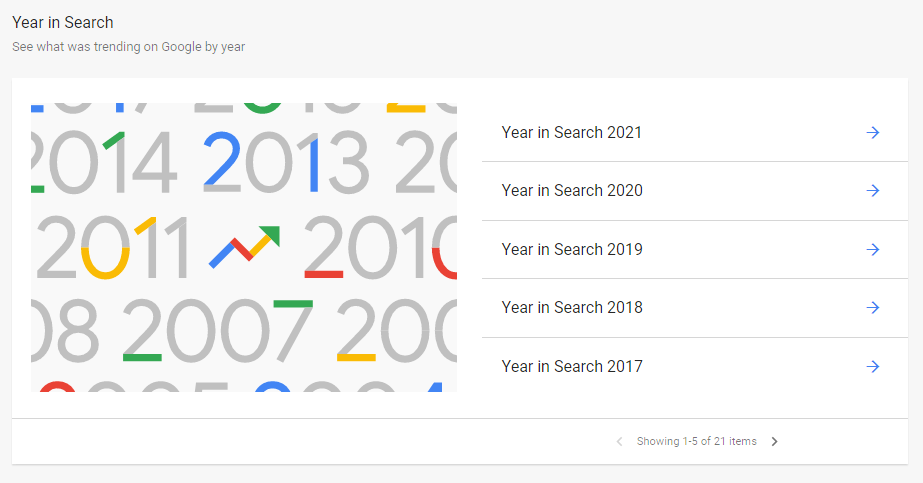
One more section (“Year in Search”) shows yearly trends:
Clicking on an arrow provides you with insights into search queries typical of a specific year.
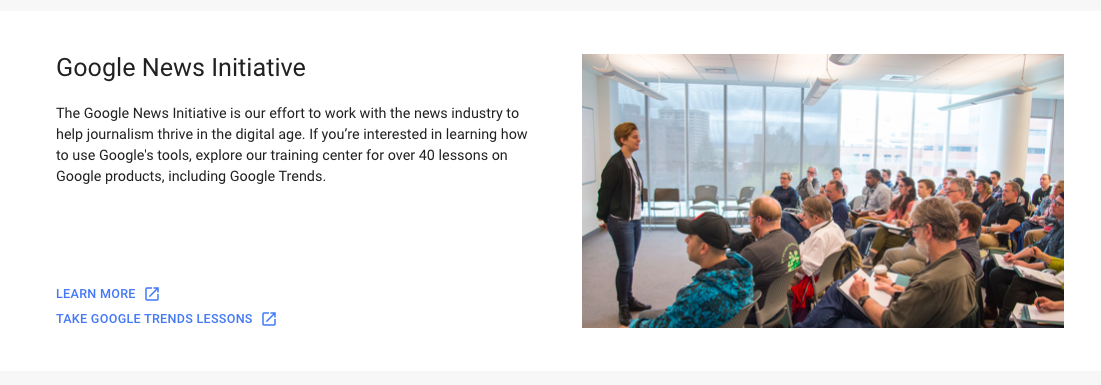
The last section is dedicated to the Google News Initiative project for journalists. Follow the links to learn more about the project, and visit the Google Trends training center (Google Trends lessons).
Quick start: how to find popularity of the search term
In a Google Trends search bar, enter a search term or topic you are interested in.
You’ll be automatically redirected to the “Explore” section, where you can find the seasonality of the search volume, keyword popularity by region, and other insights.
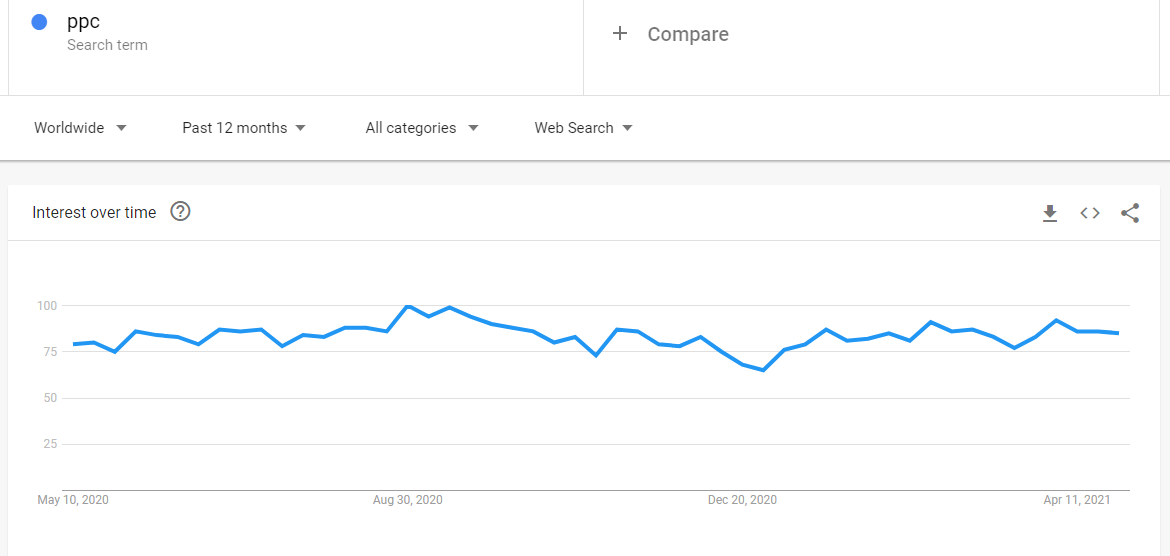
You can see how interest in the search term changes over time. By default, Google Trends shows data for the last 12 months. You can change the date range, region, user category, and search type, if needed.
Google Trends vs Keyword Planner: what is the difference?
PPC managers use Google Keyword Planner for keyword research. What makes it different from Google Trends?
Keyword Planner shows absolute values, while Google Trends data is relative
In Google Trends, statistics for regions A and B with the same number of search queries differ if the total number of queries for all keywords is different. As we know from school, once the divisor changes, the quotient changes as well:
А = С/D and B = С/E
This doesn’t happen in Keyword Planner because the tool uses absolute values. If the number of requests for the phrase “buy a scooter” in NY and LA is the same, the Planner will show the same values.
Google Trends is not about keyword research in scale
You can enter several basic keywords to the Keyword Planner and get a list of related keywords. In Google Trends, you can compare up to five keywords, but in general, the service is not suitable for analyzing big data.
Google Trends shows search trends for a wider date range
In Google Trends, you can see how the popularity of a query has been changing from 2004. Keyword Planner will show only the summary search volume per month for the last year.
Let’s sum up
Google Trends and Google Keyword Planner are created for different purposes. Keyword Planner is helpful for PPC keyword research and budget planning.
If you need to understand the general demand trends and evaluate the seasonality, you should use Google Trends.
How to Read and Understand Google Trends Stats
Google Trends collects data based on user queries on Google Search. The data is anonymized, categorized by topics, and aggregated into groups. Users can access statistics for any country and city around the world where the search engine is used.
Google Trends provides access to the samples of search requests, not the search volume
What does it mean?
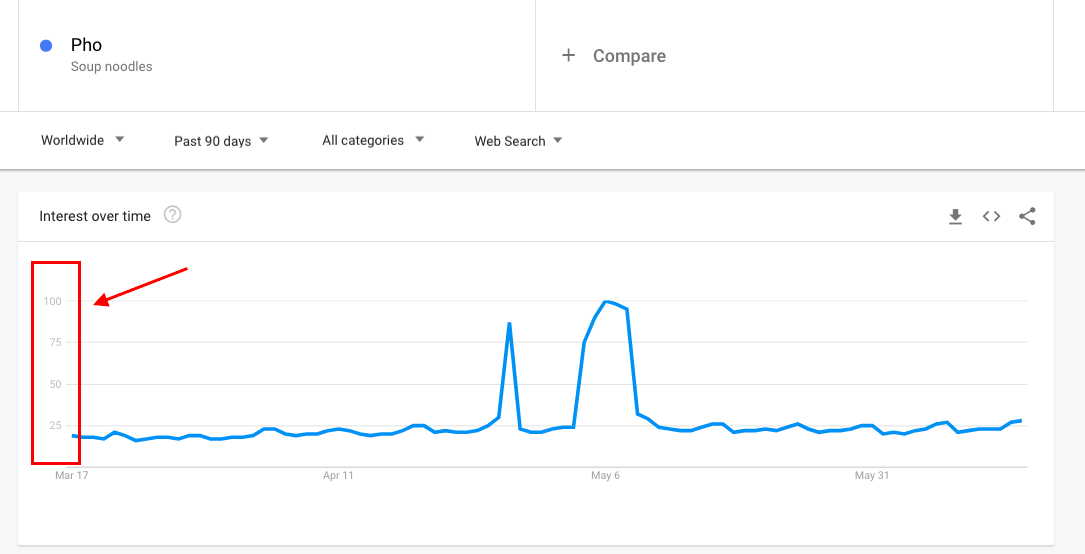
In Google Trends, you can see the ratio of a query’s search volume for a particular term or topic to the total searches of the geography and time range.
The data becomes normalized, meaning it is converted to a 100-point scale. The largest relative indicator is assigned 100 points. The remaining values are compared with it and are given a value from 0 to 99.
There are two samples of Google Trends data:
- Real-time data (over the last seven days).
- Non-realtime data (from 2004 and up to 36 hours before your search).
Google Trends filters out unpopular searches (i.e. searches made a few times), repeated searches from the same person over a short period, and queries with special characters.
How to Use Google Trends in Real Practice: 9 Examples
Let’s see how marketers and business owners use Google Trends.
Example #1: Identify seasonal keyword trends
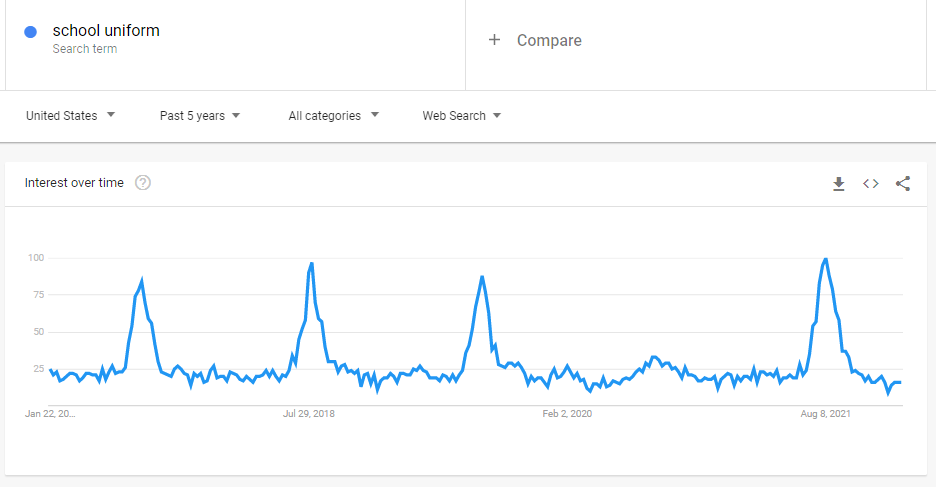
Some products have a pronounced seasonality. Seasonal peaks and bottoms can be easily discovered in the Google Trends’ “Explore” section.
Also, you can enter the query in the search bar on the Google Trends home page.
The query “school uniform” perfectly illustrates seasonal demand. The peaks occur at approximately the same time every year: late July and the beginning of August.
Understanding seasonal keyword trends, you open the new revenue opportunities for business:
- You could schedule ads and adjust bids for your campaigns.
- You can plan website SEO activities. For example, moving to a new CMS or website redesign is safer during the low season.
- You’ll be able to understand the overall traffic change throughout the year.
Example #2: Discover the popularity of a query by region
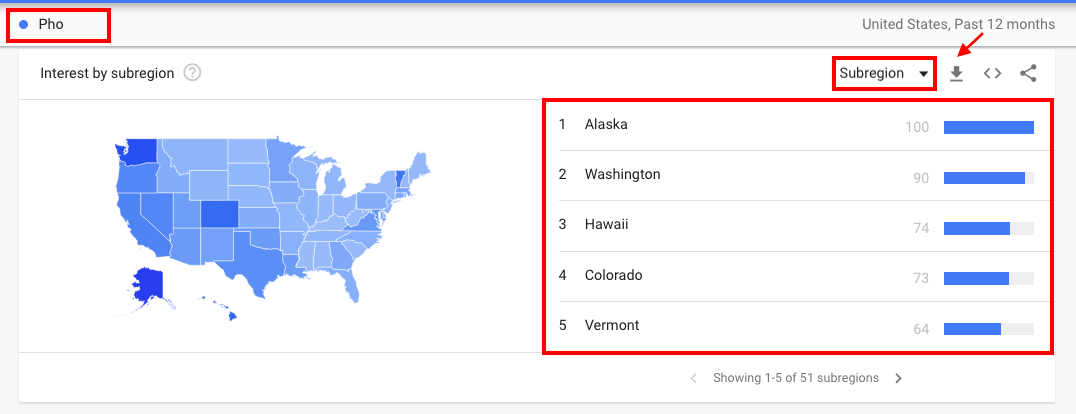
The “Explore” section shows the popularity of the request by region and city. Stats are presented as a heat map and a list. You can download it in CSV:
The popularity of the query is shown by subregion or city. This is a useful feature for businesses entering new regions: you can roughly estimate market demand for a product. This information will help you assign the budget between regions.
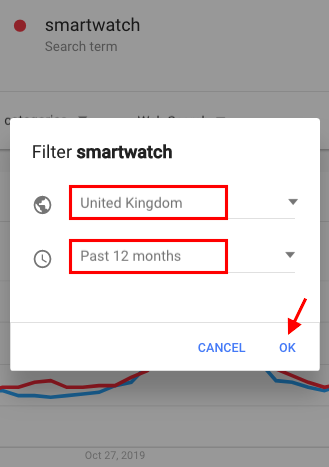
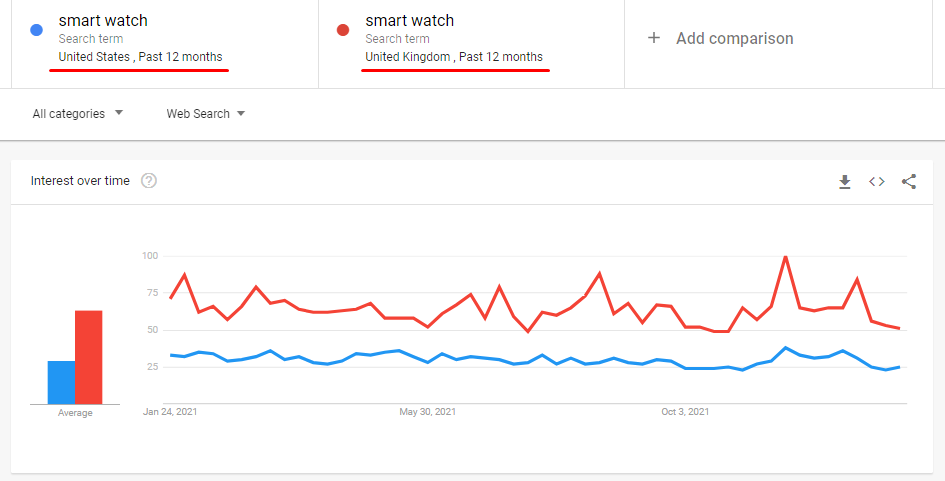
If you are setting up ads for the whole world, Google Trends allows you to compare the popularity of the same query in different countries. To do this, enter two identical queries. Use the Change filters feature on the right to select the region and time range for each query:
Note. You can’t compare the same queries till you change the location. So you can enter a similar query, choose the location, and, after that, correct the compared query.
The graph allows you to compare the request popularity in the specified regions:
Example #3: Find new keyword ideas
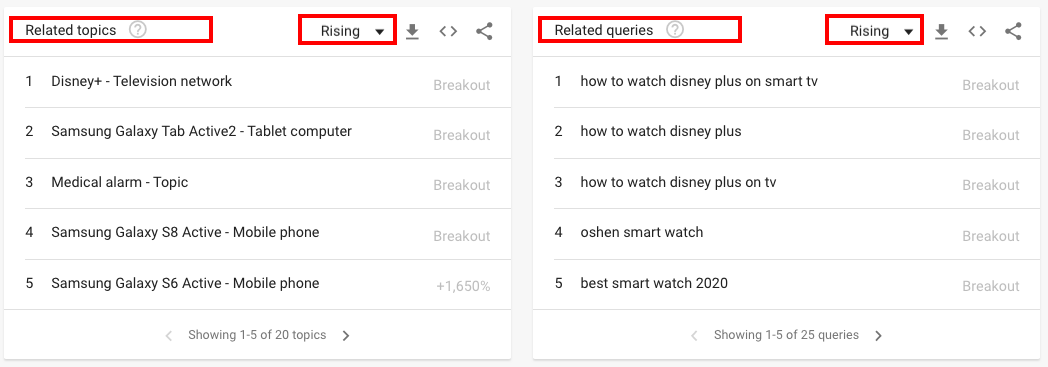
Google Trends contains two extremely helpful sections: “Related topics” and “Related queries.” You can find them below the Interest by region map:
“Related topics” contains information about the queries people are looking for – in parallel with searching for your term. This data helps you set up interest targeting for ad campaigns.
In “Related queries,” you can discover other keywords that are thematically related to the specified keyword. This section can be used as a source of new keyword ideas.
In both sections, you can select a view mode:
- Top. Queries or topics are distributed on a 100-point scale depending on popularity.)
- Rising. Queries or topics that have increased interest in comparison with the previous period.
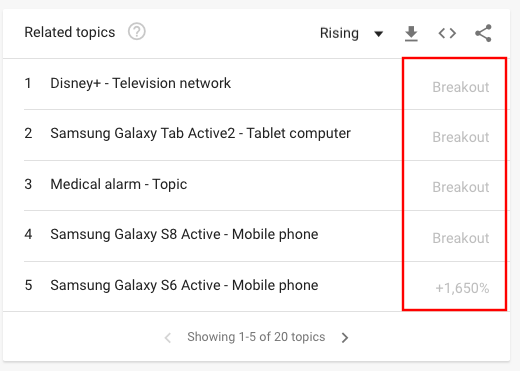
The last view mode contains queries that are gaining popularity. An increase in popularity is indicated by percentages. If interest has increased by more than 5000%, instead of the percentage increase, a query will be marked as “Breakout”:
You should use queries with increasing popularity in ad campaigns to leverage a growing interest in the topic.
Keep in mind that Google Trends has limited keyword research opportunities. It’s more about understanding the overall trends than keyword collecting. To quickly find tons of keywords from several sources, leverage PromoNavi’s Keyword Planner. Enter basic keywords, choose the country, and run a search. You can filter out keywords, group them, and push directly to your Google Ads campaign (or create the new one).
Example #4: Analyze your competitors with Google Trends
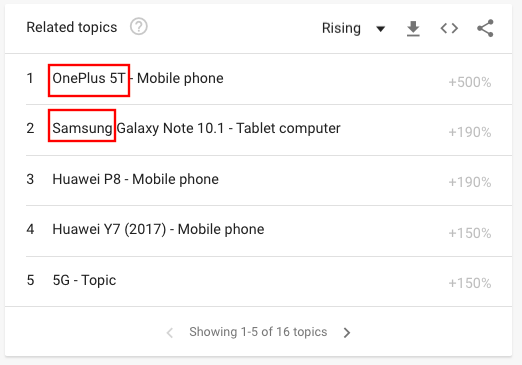
The “Related topics” and “Related queries” features allow you to detect brand competitors that the target audience is interested in.
For example, when checking the brand name Huawei, you can find that people are also looking for Samsung and OnePlus:
You can use this data for various purposes:
- Create a competitors list.
- Identify the product category that you are competing in.
- Describe your competitive advantages.
- Make an article with a comparison between your product and a competing one, where your proposal will look more attractive.
- Describe your USPs on the landing pages.
- Emphasize your USPs in PPC campaigns.
To learn more about competitor analysis, we recommend you explore the article 10 Advanced Tips to Analyze Your PPC Competitors.
Example #5: Find the best wording for high-frequency keywords
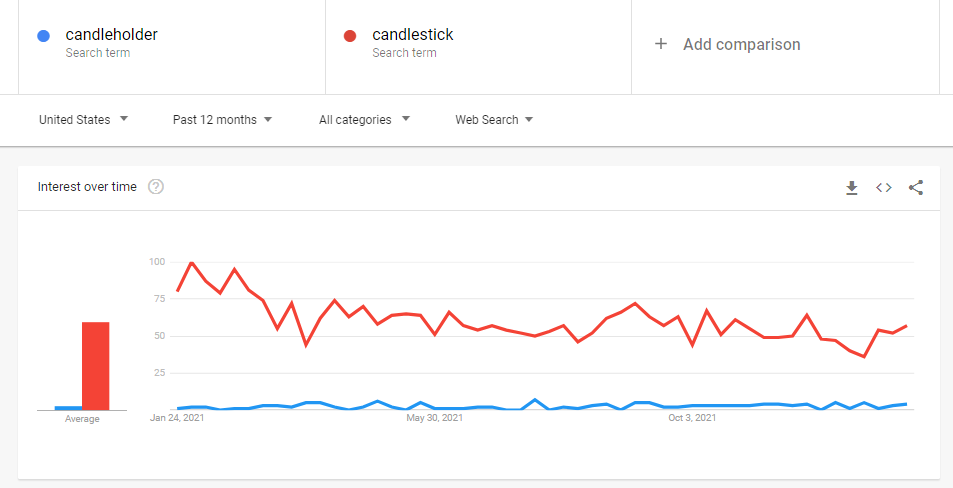
When doing keyword research and optimizing a website, you should focus on the most prospective high-frequency keywords. As you can see from the example below, the word “candlestick” is more frequently used than “candleholder.”
Example #6: Find the most popular product in the product range
This scenario is similar to the previous one. When the ad budget for a product range is limited, you can start advertising the most popular products.
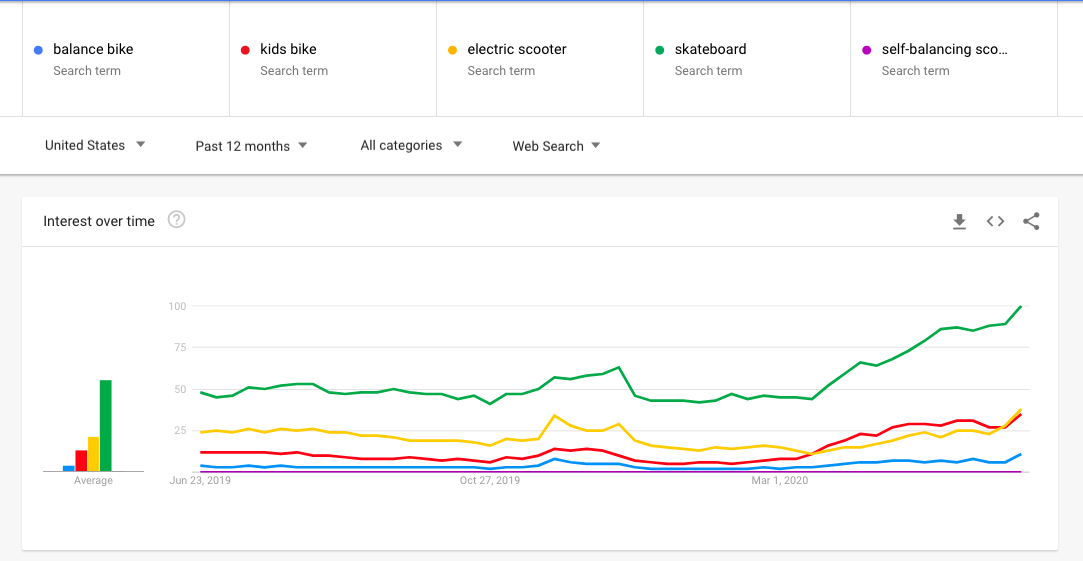
For example, let’s check the most popular keywords before launching a campaign dedicated to children’s vehicles:
We see that “skateboard” is the most popular keyword, and you should focus on it when setting up a PPC campaign for the product category.
3 Ways to Create a Google Merchant Feed for Your Shopify Store
Example #7: Analyze YouTube trends
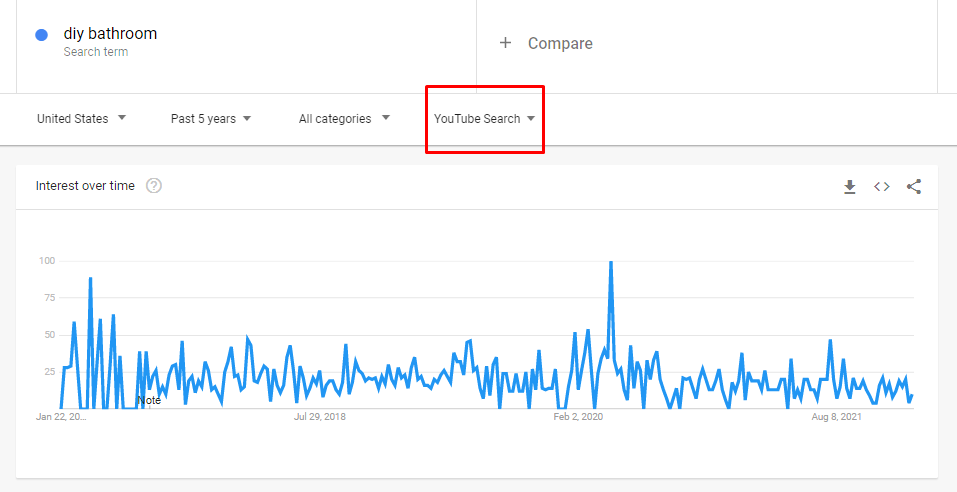
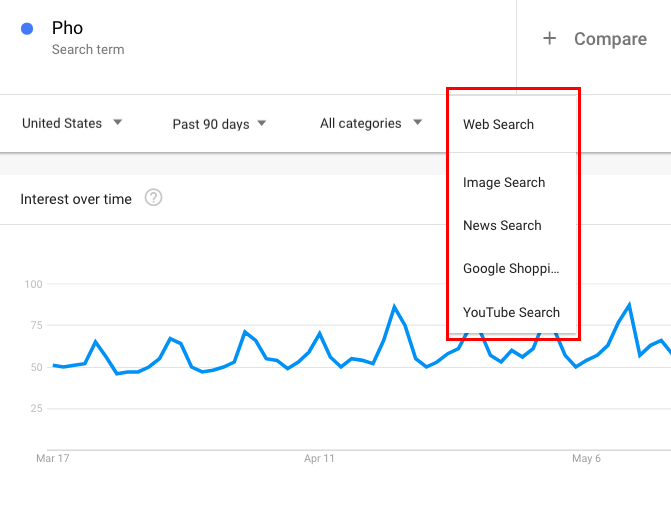
To effectively promote a YouTube channel, it’s important to choose topics that are popular among the target audience. Google Trends will help you with this once you select “YouTube Search” on the drop-down:
Videos also tend to appear on the Google SERP, including a Featured Snippet on the top of the page. Choosing the right topic and optimizing your video, you can drive traffic not only from YouTube but also from Google Search.
50+ PPC Automation Tools [The Most Comprehensive Compilation]
Example#8: Discover a burning topic for an article or a social media post
SMM managers use trends to attract the audience’s attention no less than the media.
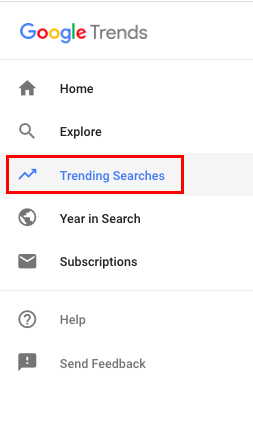
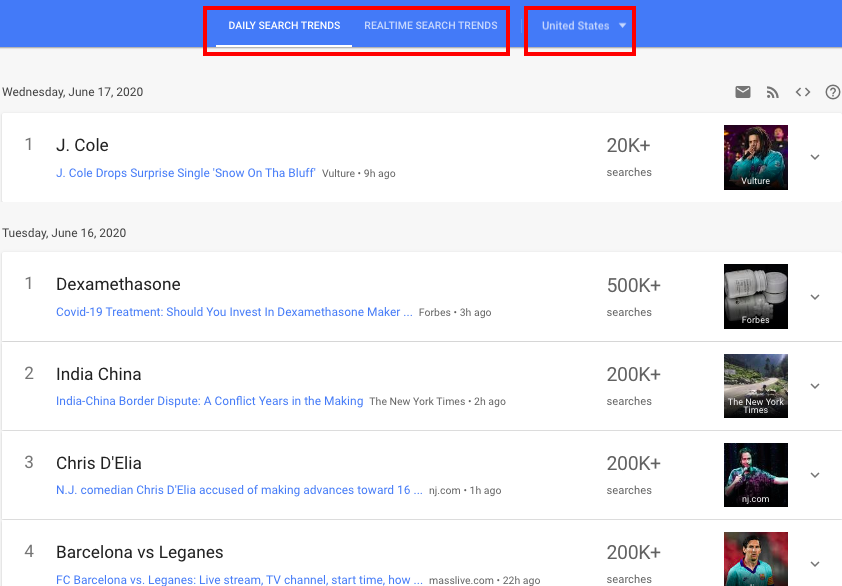
To check whether an interest in the topic is growing or declining, use the “Trending Searches” feature.
You can find queries in two tabs:
- Daily search trends. These are queries that have increased in frequency over the past 24 hours.
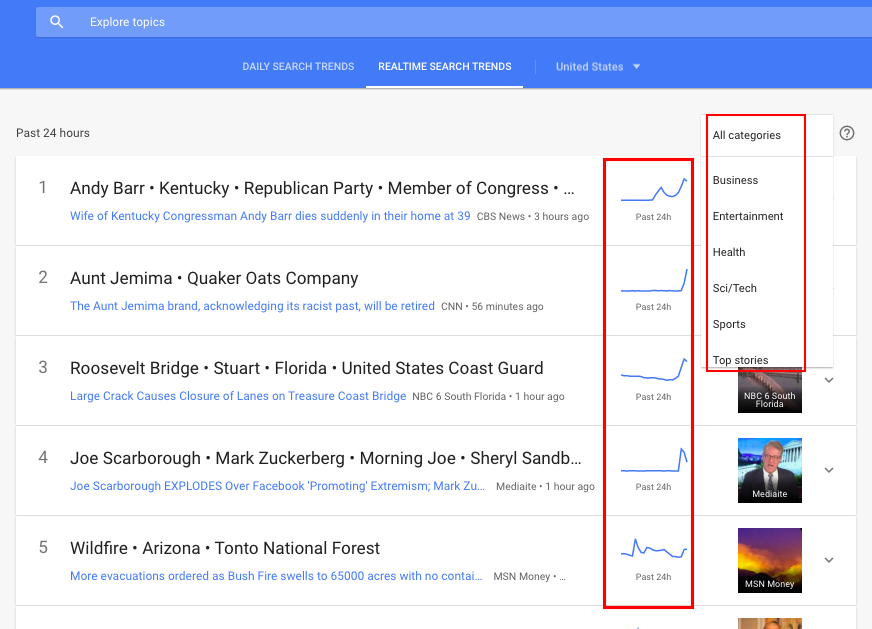
- Realtime search trends. Here, you can find popular queries in real-time in the selected region.
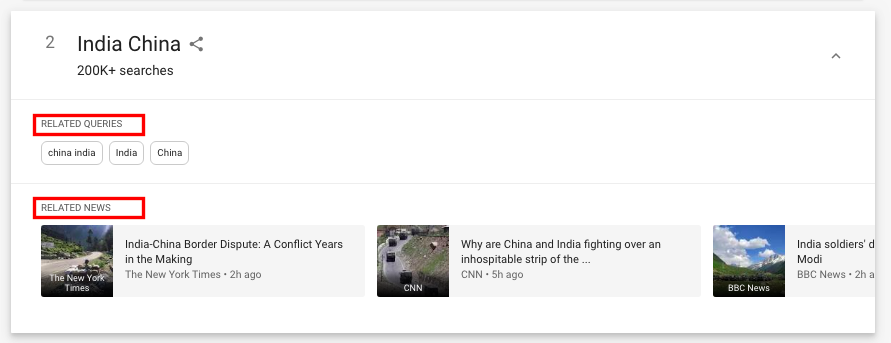
Click on the arrow next to the image to see information about related queries (if there are any) and links to related news from Google News that include the query.
You can subscribe to daily trends, create an RSS feed, or get a code and embed it into your website.
The “Realtime search trends” tab shows the change of interest in the topic over the past 24 hours. You can choose a specific category.
When you click on the graph or arrow, you will see a trend chart with the number of articles, and links to popular articles.
Example #9: Look into popular topics for a specific year
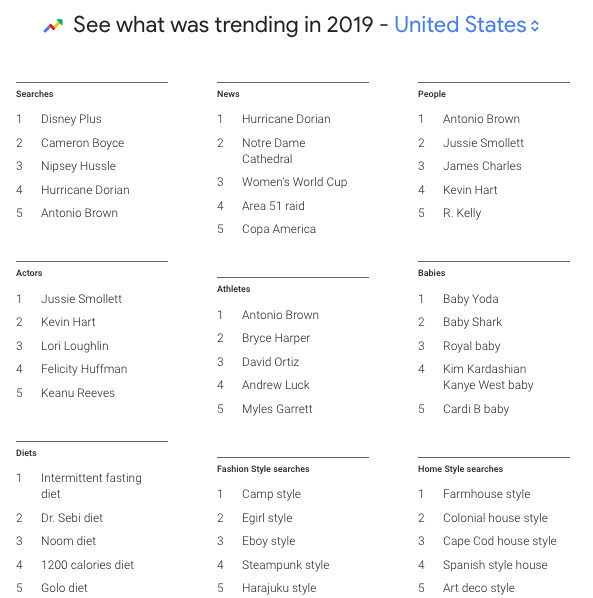
Go to “Year in search” to discover statistics on search queries that showed a significant increase in traffic compared to the previous year.
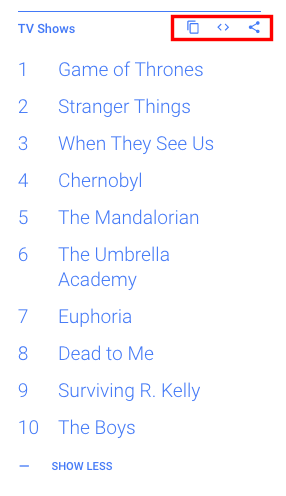
Here you can find ten popular topics in the selected country, grouped by category. By default, the top five are shown, and the “Show more” link appears when you hover over the category. For example, here are the most popular search queries in the US in the previous year:
The number of categories and their names vary depending on the country.
You can copy these lists, embed them on the site, or share in social networks:
The section can be used as a cheat-sheet reminder of the topics that were popular a few years ago.
How to Make Your Google Trends Search More Precise
Use search operators
By default, Google Trends statistics for a query contains results for keywords that include words from this query in any order, and additional words. For example, in response to a query “winter shoes,” you will be given the data for phrases like “blue winter shoes,” “kids winter shoes,” and so on. Queries with mistakes, different spelling variations, in plural or singular (“winter shoe”), as well as synonyms are not considered.
To refine the data, use Google Trends operators. The system supports the following:
- Quotation marks ” “. The system will display results that include the exact phrase with the same word order, but there can be words before or after the basic phrase. For example, statistics for the query “winter shoes” will include the data for the query “blue winter shoes.”
- Plus +. It replaces the conjunction “or.” Statistics will include results for one or the other word. For example, for the query “swimsuit + bikini,” the results include the data for “women’s swimsuit” and “bikini styles.”
Another way to use the + operator is to combine different spelling options, including spelling errors. For example, for the query “Hyundai + Henday + Hendai,” the statistics will include all these spelling options/mistakes.
- Minus. It excludes a word from the query. For example, for the query “swimsuit – bikini,” the statistics will include the data for “blue swimsuit,” and ignore”bikini swimsuit.”
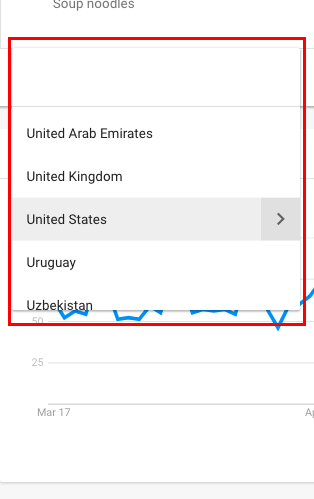
Define the region
Choose the country for which you want to see the trends.
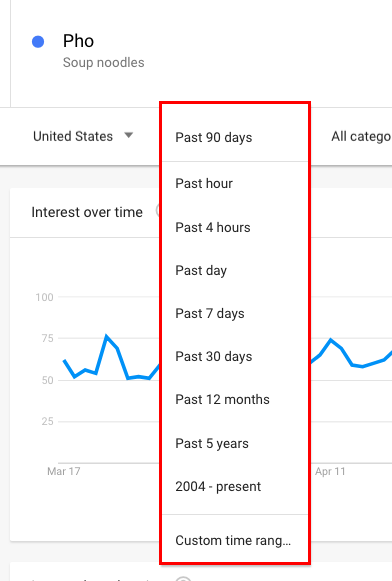
Define the time range
Get the real-time data or historical trends using date presets, or specify the custom time range.
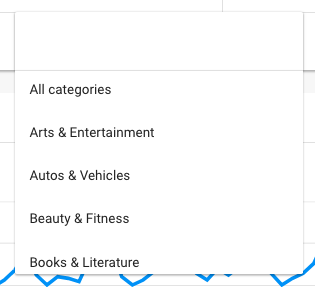
Specify the request by category
This is required when a word or phrase has multiple meanings or belongs to several thematic clusters:
In a drop-down menu, you can choose a category:
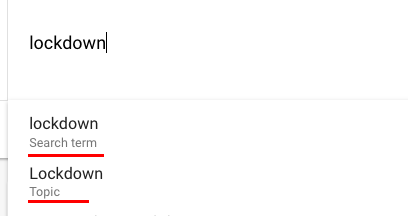
Consider the difference between a search term and a topic
That helps you get more accurate data.
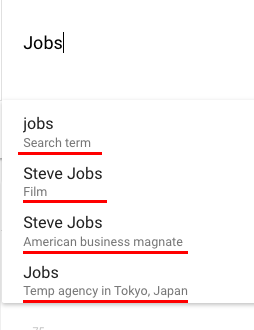
Data for a specific word or phrase without operators contains a selection for queries containing only the specified words. The topic is a broader concept. It refers to the entire set of search queries that describe it.
Select a search resource
That may be Web Search, Image Search, News Search, Google Shopping, or YouTube Search.
To Wrap Up
Google Trends is a free tool that helps marketers to discover the burning trends and seasonality in search demand. For example, you can easily find peaks and bottoms in search demand for specific products. This allows you to plan your marketing activities, i.g. run Google Ads campaigns, adjust bids, and use additional communication channels.
However, Google Trends is not suitable for specific digital marketing tasks, such as keyword collecting or competitor research. Here, it would help if you used PromoNavi tools to automate routine tasks and get profitable insights to boost your digital marketing.





![30+ Best Alternatives to Google Analytics [Free & Paid]](https://blog.promonavigator.com/wp-content/uploads/2021/04/ga-alternatives-600-360-1.jpg)
![How to Set Up Automated Rules in Google Ads [10 Real-Life Examples]](https://blog.promonavigator.com/wp-content/uploads/2021/01/automated-rules-600-360-1.jpg)