Quality Score is a diagnostic metric that helps you determine how well your ads are compared to other advertisers. It is also one of the factors that determine your CPC and AdRank. That’s why it’s so important for PPC managers to always keep an eye on the Quality Score and take data-driven actions.
We have already published a comprehensive guide on Quality Score—Google Ads Quality Score Report: How to Build It and Read the Data. From this post, you can learn the components of Quality Score and what weight they have, how Quality Score affects other PPC metrics, how to create and read Quality Score reports, and how to improve your Quality Score based on report data.
Here is a quick reminder for you. Quality Score has three components: Expected Clickthrough Rate, Ad Relevance, and Landing Page Experience. Each of these components can have a score of Below Average, Average, and Above Average. The final Quality Score is a combination of these components, and it results in a number between 1 to 10. Therefore, to improve your Quality Score, you need to work on each element and focus on parameters marked as Below Average and Average.
A typical workflow to uncover Quality Score problems requires filtering keywords by low Quality Score and deciding whether or not to discard them. However, this involves a lot of manual work. Luckily, there are ways to automate this process, for example, Google Ads Scripts. In this blog post, you will find nine helpful scripts.
Let’s start!
Quick Links
1. Advanced Quality Score Tracker Script by Clicteq
2. Quality Score Analysis Script by Karooya
3. Quality Score Tracker Script by Epiphany
4. Quality Score Tracker MCC Script by Adsscripts
5. Store Account, Campaign, AdGroup, and Keyword Level Quality Score Script by Russ Savage
6. Low Quality Score Alert Script by BrainLabs
7. Keyword Quality Score Report Script by Vladimir Jones
8. Quality Score Analyzer for Search Script by PPCnerd
9. Analyze Quality Score in Detail Script by PPCHero
Here is an Alternative: PromoNavi’s Quality Score Report Template
1. Advanced Quality Score Tracker Script by Clicteq
With the Advanced Quality Score Tracker by Clicteq, you can track the daily performance of Quality Score factors: landing page experience, ad relevance, and expected CTR.
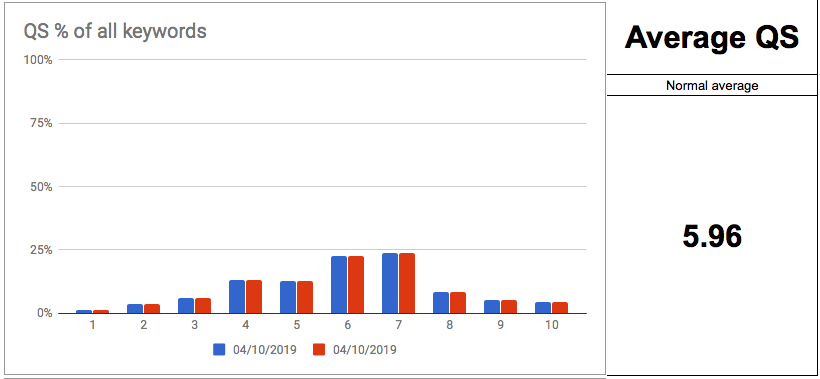
The script creates a sheet on your Google Drive with graphs that display how your Quality Score is performing. Here are some of them:
- On the first chart, you will see the percentage of keywords in each Quality Score band (1 to 10). Blue shows the Quality Scores on the first day that the script was running, and red indicates the actual data. This way, you can compare how your Quality Score has changed.
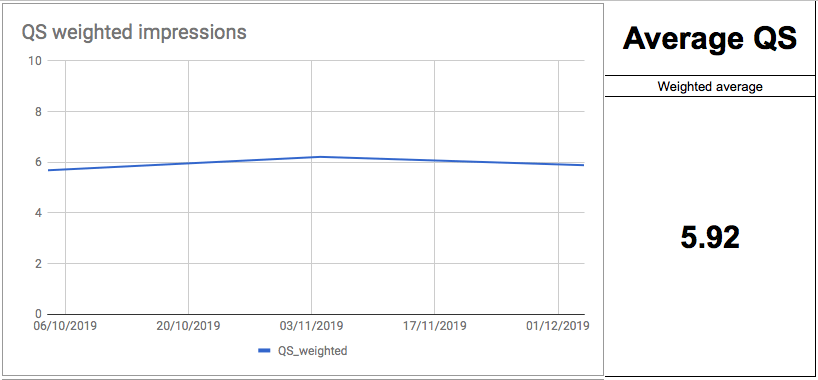
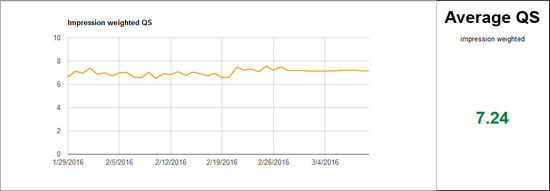
- The following chart displays the impression-weighted Quality Score daily so that you can see how it alters.
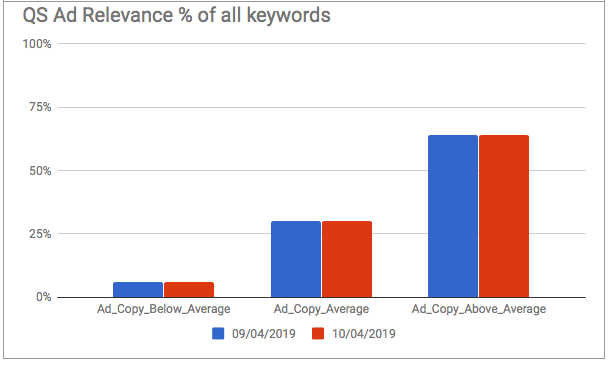
- There is also a separate graph for each of the three Quality Score components:
Before you run the script, do the following:
1. Create a new document in Google Sheets, and copy the URL.
2. Paste the sheet URL into the script.
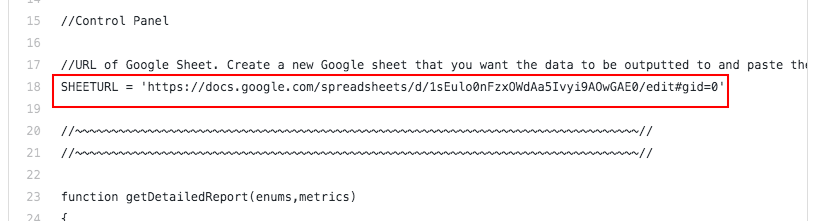
3. From the Google Ads script dashboard, schedule the script to run daily.
2. Quality Score Analysis Script by Karooya
This script from Karooya allows you to automatically export keyword performance data along with Quality Score to a spreadsheet.
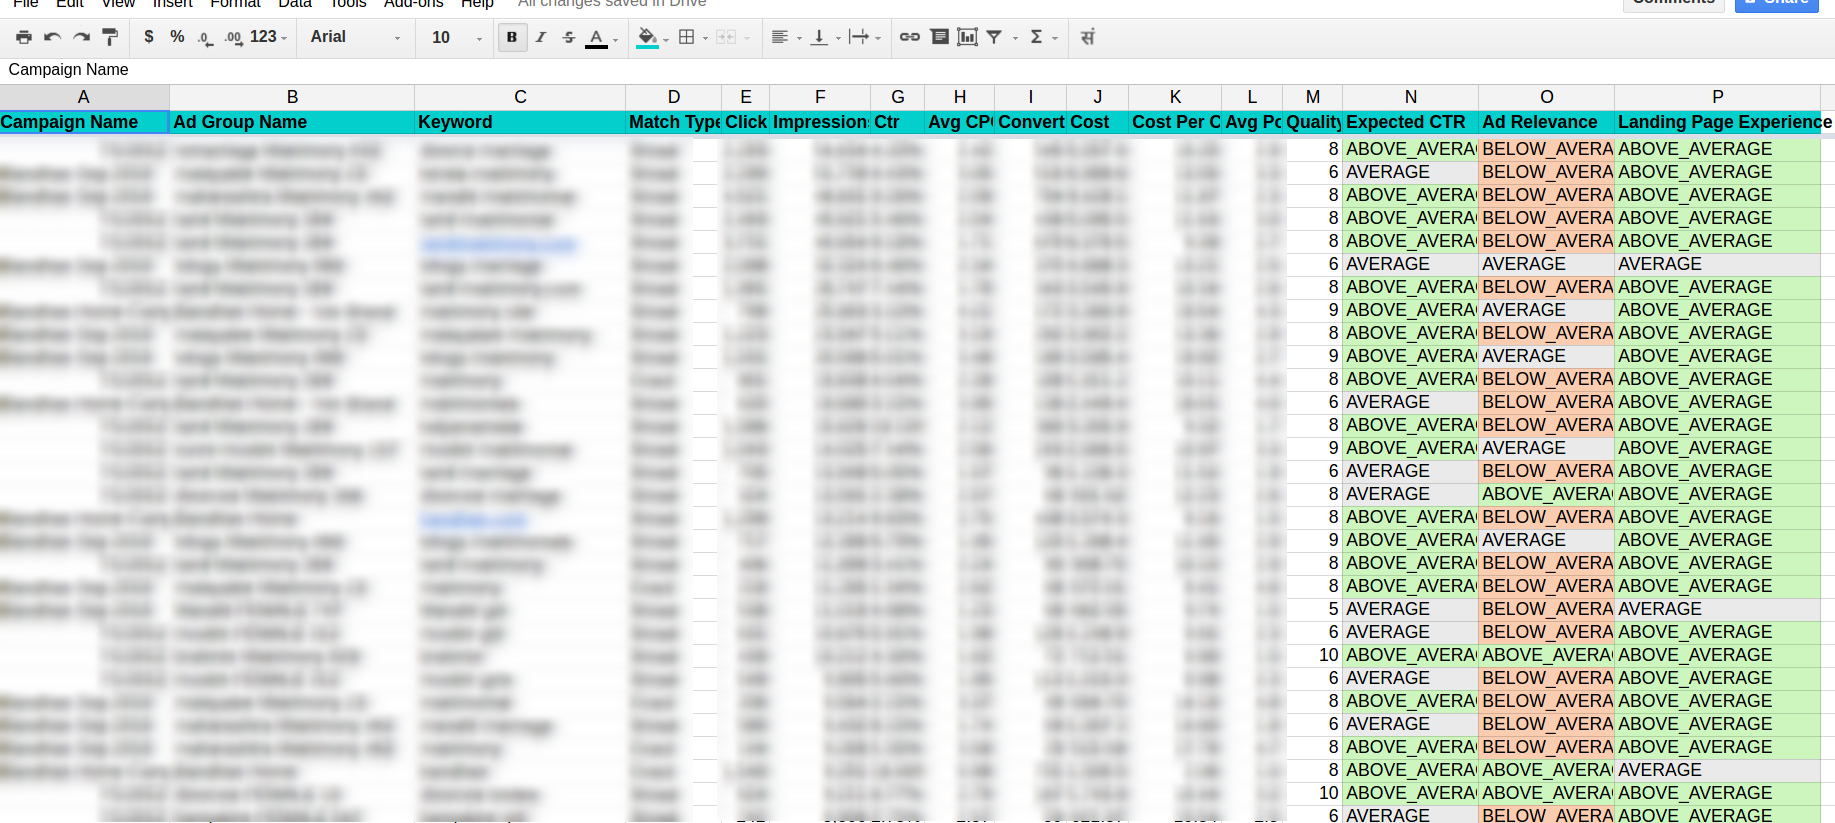
On the summary sheet, you will find key performance metrics for your keywords: Clicks, Impressions, CTR, Average CPC, Conversions, Cost, Cost per Conversion, Average Position, as well as the Quality Score and its components: Expected CTR, Ad Relevance, and Landing Page Experience. The Average score has a neutral grey background, the Above Average score is highlighted with a green background, and the Below Average score—with a red one.
Next, you will discover several charts which visualize further insights.
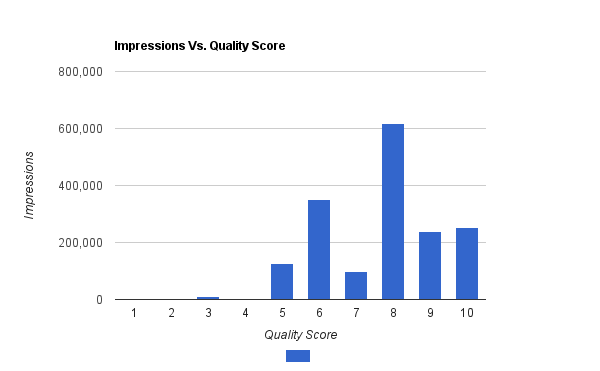
- One of the charts shows you the total number of impressions for each Quality Score. You can create similar charts for other metrics, for example, for Quality Score vs. CPC/Spend/Clicks/:
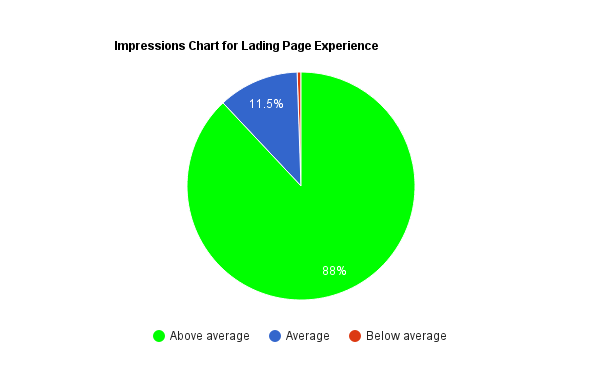
- You can also analyze the performance of the landing pages. For example, this pie chart shows that 88% of the impressions for the keywords have a Landing page experience of Above Average.
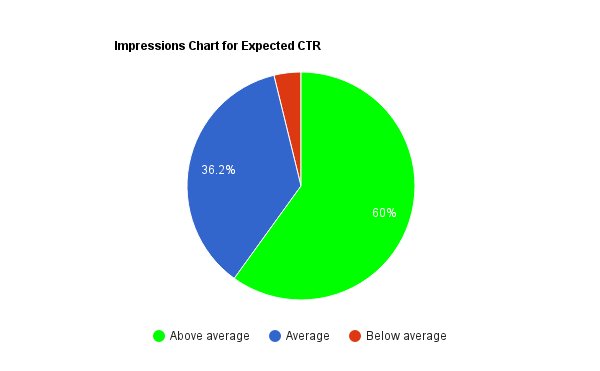
- It’s also possible to create similar Impression charts for the Expected CTR and Ad Relevance, or for Cost vs. any Quality Score component:
Copy your script from here, and don’t forget to change the following variables:
- REPORTS_FOLDER_PATH : The name of the folder that the script will create on your Google drive.
- DATE_RANGE: By default, the script will get the data for the last 30 days. You can choose from two predefined ranges: LAST_30_DAYS and LAST_14_DAYS.
- USE_CUSTOM_DATE_RANGE : Set it to TRUE if you want to use a custom date range. Enter a START_DATE and an END_DATE to define the date range. The date format is “yyyy-mm-dd.”
- IS_MCC_ACCOUNT : Change it to TRUE if you want to use this script for a Manager account. The results for each singular account will be located in a separate sheet.
- IGNORE_PAUSED_CAMPAIGNS and IGNORE_PAUSED_ADGROUPS : By default, these are set to TRUE. If you want the script to analyze all keywords, including those in paused campaigns and ad groups, set it to FALSE.
- MAX_KEYWORDS : By default, you will get a report for the top 1,000 keywords in the account. Change the value if you want to get results for more keywords.
3. Quality Score Tracker Script by Epiphany
Use this script from PPC Epiphany to monitor the fluctuations of the Quality Score in your account.
Quality Score Tracker creates a folder on your Google Drive and quarterly generates a document with Quality Scores for all keywords in your account per day. The script also creates an overview spreadsheet with the averages per date so that you can get insights into the changes of the Quality Score over time and understand the distribution of the Quality Score across the account.
The script is straightforward to use; it requires no further setup. However, if you are willing, you can change some settings to customize the tracker. For example, you can add additional charts to the dashboard, like a click weighted Quality Score.
Here you can find an extended version of the script by Tibbe van Asten.
4. Quality Score Tracker MCC Script by Adsscripts
This is another version of the previous script created for Manager accounts. If you manage multiple accounts, it’s easier to use this one so that you don’t have to set up the script separately for every single account. Make sure this script runs once a day.
To make use of this script, you need to make just one or two changes.
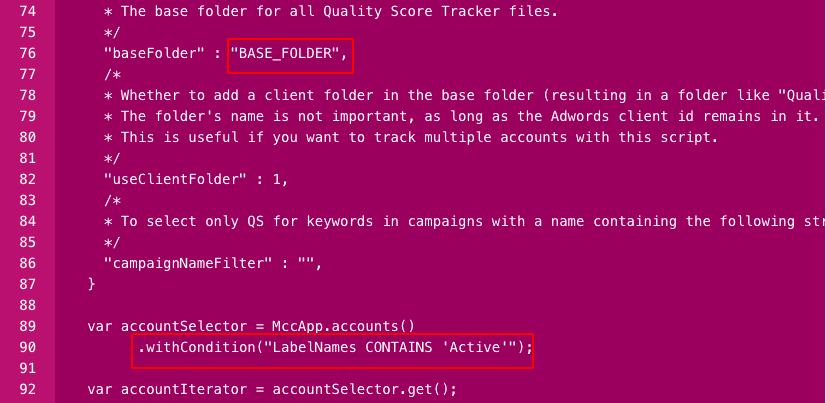
- “BASE_FOLDER”: Replace it with the name of the folder where you want to keep the data on your Google Drive. You can select subfolders by using a slash.
- You can use a filter option in the AccountSelector to select only accounts with the label ‘Active.’ If you want to include all accounts in your Manager account, remove ‘.withCondition ();.’
Here is a tip: The developers created a sheet you can use to get an overview of the Quality Scores for all your accounts.
50+ PPC Automation Tools [The Most Comprehensive Compilation]
5. Store Account, Campaign, AdGroup, and Keyword Level Quality Score Script by Russ Savage
Using this script from Russ Savage, you can store ad group, campaign, and account-level Quality Score for the top 50,000 keywords in your account. The script stores the results in a spreadsheet on Google Drive.
Before running the script, adjust the following variables:
- DECIMALS: Decide how many decimal places of accuracy you need.
- DATE_RANGE: Choose from TODAY, YESTERDAY, LAST_7_DAYS, THIS_WEEK_SUN_TODAY, THIS_WEEK_MON_TODAY, LAST_WEEK, LAST_14_DAYS, LAST_30_DAYS, LAST_BUSINESS_WEEK, LAST_WEEK_SUN_SAT, THIS_MONTH.
- LAST_N_DAYS: Use it alternatively to DATE_RANGE; you can set this to any number of days you need.
- CSV_FILE_PREFIX: Set this if you want to write to a set of CSV files.
- SPREADSHEET_URL: Set this if you have the URL of a spreadsheet you want to update.
- SPREADHEET_NAME: Set this if you want to write to the name of a spreadsheet.
6. Low Quality Score Alert Script by BrainLabs
This script from BrainLabs can save you lots of time when you need to fix keywords with a low Quality Score. Just set a Quality Score threshold, and the script will alert you via email when it detects keywords with a score equal or lower to that value.
To make those keywords easier to find, the script labels them. And if you want, you can even make it automatically pause all low Quality Score keywords.
The developers recommend setting up a regular schedule depending on how often you’d like the script to check your Quality Scores for you.
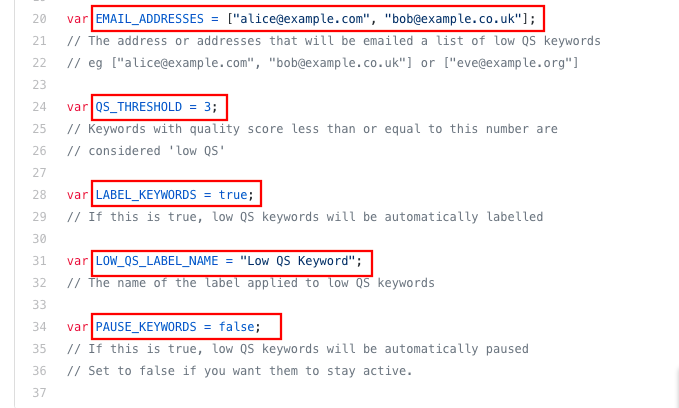
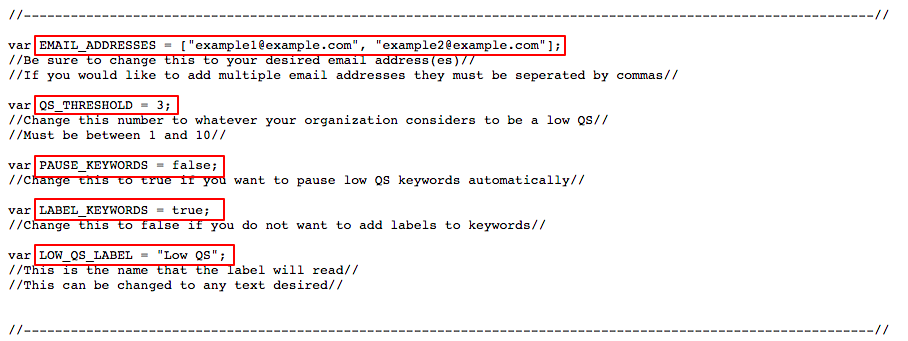
Before you activate the script, edit the following variables:
- EMAIL_ADDRESSES: A list of the email addresses that will get notifications of the low Quality Score keywords.
- QS_THRESHOLD: Define the Quality Score value that the script will consider as “low.”
- LABEL_KEYWORDS: Set it to TRUE if you want the script to label low Quality Score keywords automatically.
- LOW_QS_LABEL_NAME: Insert the name of the label if you have set LABEL_KEYWORDS to TRUE.
- PAUSE_KEYWORDS: Set this to TRUE if you want the script to pause low Quality Score keywords automatically.
You need to enter your email to get access to the script.
7. Keyword Quality Score Report Script by Vladimir Jones
This script from Vladimir Jones is very similar to the previous one. You can try both of them and decide which works better for you.
This script finds and labels low Quality Score keywords, pauses them automatically, and sends an email report with a list of all the labeled and paused keywords.
You can change five variables:
- EMAIL_ADDRESSES: A list of the email addresses that will get notifications of the low Quality Score keywords.
- QS_THRESHOLD: Set the Quality Score value that the script will consider as «low.»
- PAUSE_KEYWORDS: Set it to TRUE if you want the script to pause keywords with a low Quality Score automatically.
- LABEL_KEYWORDS: Set it to TRUE if you want to label your low Quality Score keywords.
- LOW_QS_LABEL: The label you want to give to the keywords with a low Quality Score.
8. Quality Score Analyzer for Search Script by PPCnerd
This Quality Score Analyzer from PPCnerd is developed both for individual and Manager accounts. It detects the Quality Score of every active keyword in your Search campaigns and gives you a breakdown of how many keywords at each Quality Score level you have.
Using this script, you can specify a score threshold for a low Quality Score and automatically pause or even delete low Quality Score keywords.
To download this script, you need an active PPCnerd subscription.
9. Analyze Quality Score in Detail Script by PPCHero
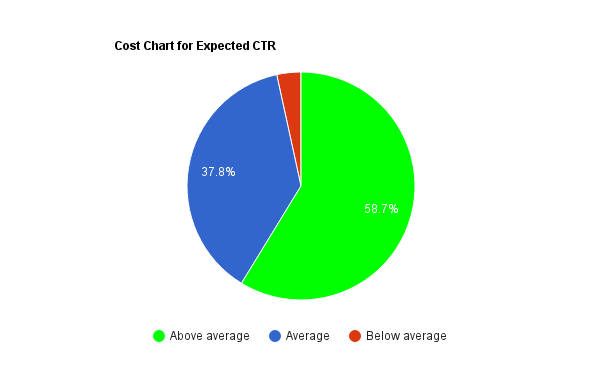
With this script from PPCHero, you can analyze your Quality Score in detail by breaking down its elements: Expected CTR, Landing Page Experience, and Ad Relevance.
The script will create a new spreadsheet on your Google Drive with the title Account Name + Quality Score Analysis. In this spreadsheet, you will find a spreadsheet with such metrics as Clicks, Impressions, Cost, Conversions, Quality Score, Predicted CTR, Ad Relevance, and Landing Page Experience.
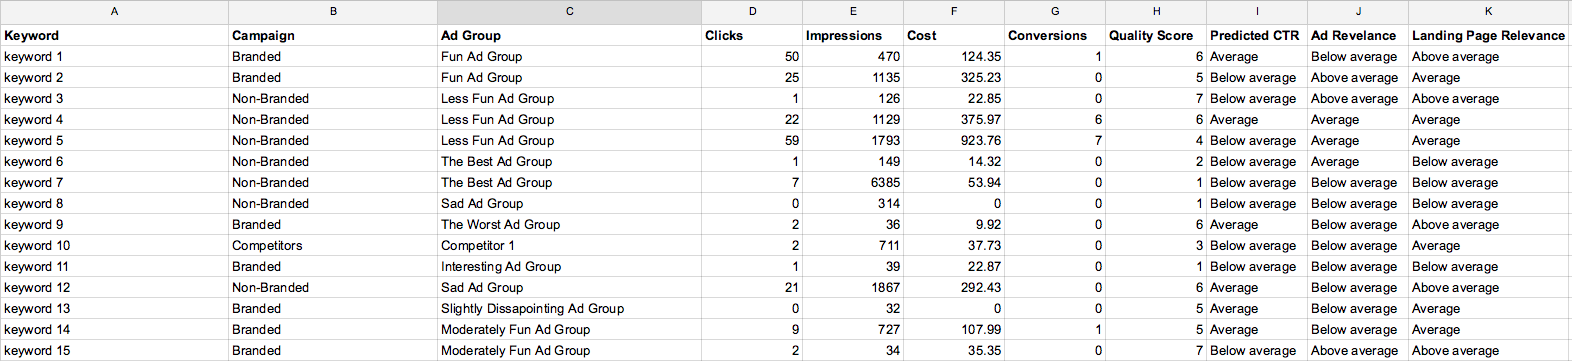
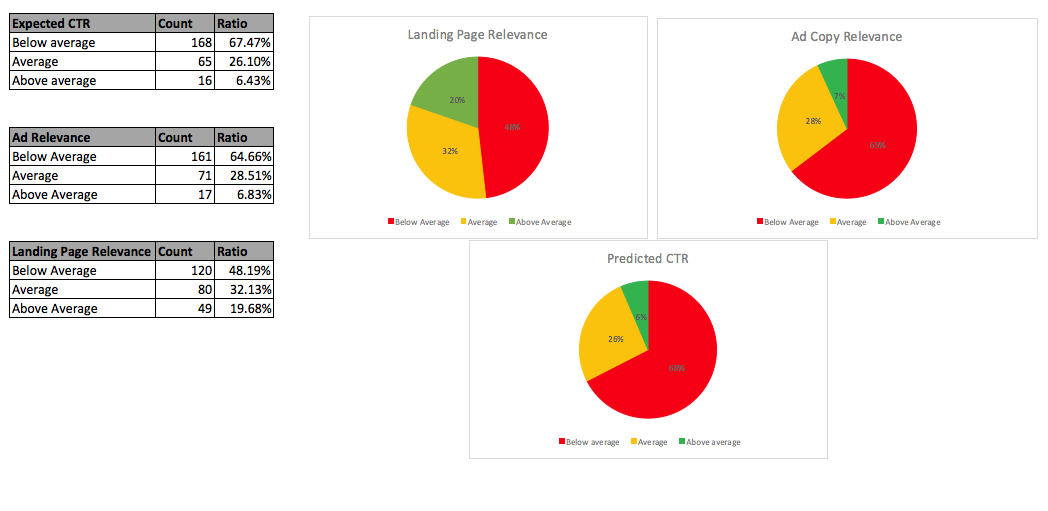
Using this data, you can build pie charts for each Quality Score category (below average, average, above average). For example, you can find out if your keywords are failing because of the predicted CTR or if there is a problem with the landing pages.
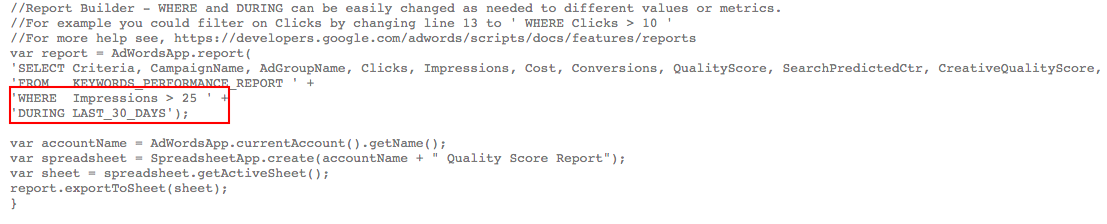
A pro tip: You can change WHERE and DURING parameters to different values and metrics. For example, you can filter on Clicks by changing ‘WHERE Impressions > 25’ to ‘WHERE CLICKS > 15’.
Here is an Alternative: PromoNavi’s Report Template for Data Studio
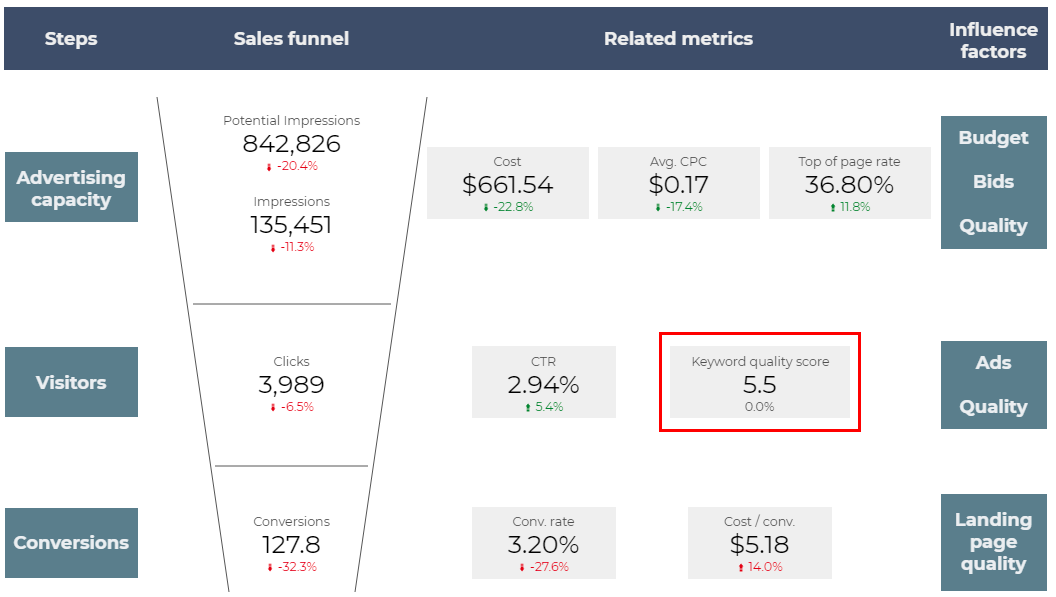
If scripts seem to be too complicated for you and you don’t want to bother with code lines, you can find stats on Quality Score in our Google Data Studio report.
- Start with the overall Keyword Quality Score on the Sales funnel page.
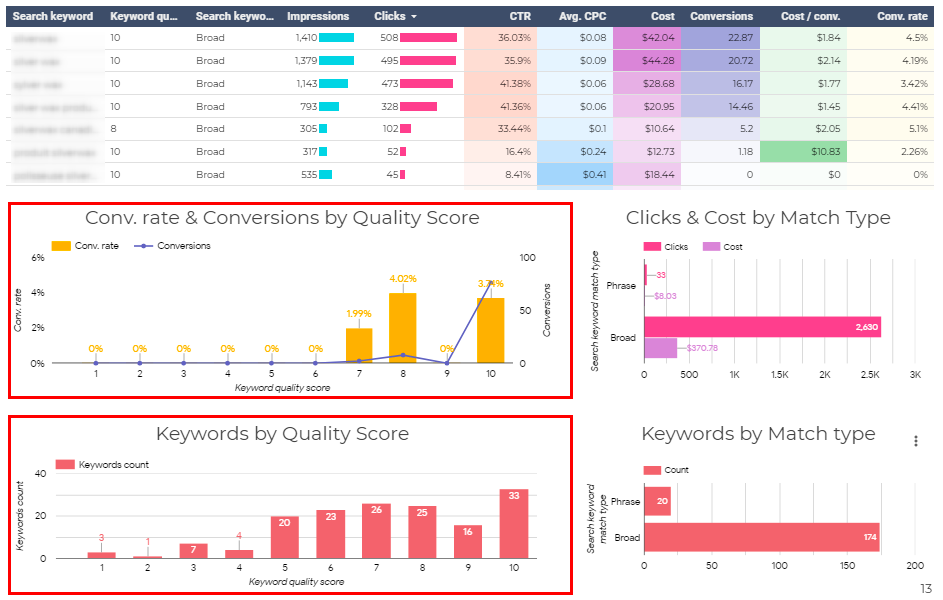
- Next, explore the correlation between Quality Score and Conversion rate to understand how Quality Score affects your Conversion Rate.
- Under this chart, you will also discover the keyword distribution by Quality Score. This data will help you understand how much work is needed to optimize your account.
You can use both our GDS report template and scripts to control your Quality Score. PromoNavi’s report will provide you with an overview of the main metrics, and scripts will give you more in-depth data and automate some manual work. Whatever you choose, keep in mind that Quality Score has a significant influence on your Ad Rank and CPC, so it makes sense to invest time and effort into improving this indicator.