Quality Score helps understand whether your ad copies and landing pages are relevant to customers’ intent. By analyzing Quality Score, you can uncover downsides in your ad copies and landing pages to fix all those issues. This is one of the essential PPC metrics you should keep an eye on.
From this article, you will learn how to build Quality Score reports and use those stats to improve your PPC performance.
Quick Links
How to Create Quality Score Reports in Google Ads
PromoNavi Quality Score Report Template
How to Improve Quality Score Based on Report Data
What is Quality Score?
According to Google,
“Quality Score is a diagnostic tool meant to give you a sense of how well your ad quality compares to other advertisers.”
Quality Score is available at the keyword level and is measured on a scale from one to ten.
Quality Score consists of three components. They are:
- Expected clickthrough rate (CTR): The likelihood that a user will click your ad.
- Ad relevance: How closely your ad matches the user’s search intent.
- Landing page experience: How useful and relevant your landing page is to potential customers who click your ad.
Each component can get one of three statuses: “Above average,” “Average,” or “Below average.” This status is based on a comparison with ads from other advertisers that were shown for the same keyword, over the last 90 days.
According to research, Google weighs Quality Score components differently when evaluating your campaigns. Landing page experience and Expected click-through rate contribute more to Quality Score than Ad relevance.
Here is the Quality Score formula:
Quality Score = 1 + Landing page experience weight + Ad relevance weight + CTR weight
And the weights are the following:
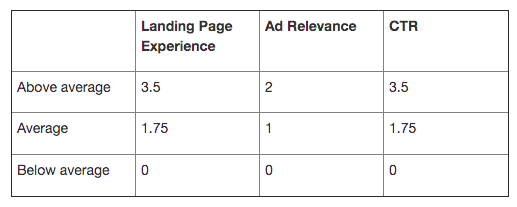
For example, if you have
- Landing page experience—Above average
- Ad Relevance—Below average
- CTR—Average
Then your Quality Score will be: 1+ 3.5 + 0 + 1.75 = 6.25
Why Does Quality Score Matter
The Quality Score is a crucial metric for advertisers. This is one of the factors that affect impressions and ad position.
How Quality Score affects your Ad Rank and CPC
The Ad Rank is influenced by many factors, including the quality of your ads and landing page. These metrics, as we mentioned above, are the part of Quality Score.
Hence, all other things being equal, if your keyword’s Quality Score is low, your ad rank will be lower—meaning that you have to pay more for the same position.
How Quality Score affects your impressions
Google may even decide not to show your ads at all for search terms triggered by low-quality keywords. Google flags this by displaying the status “rarely shown due to low Quality Score.” This message appears next to a keyword if it has a Quality Score of two or less.
How to Skyrocket Your Smart Bidding Performance: 10 Things to Check
How to Create Quality Score Reports in Google Ads
Creating Quality Score Report from the Keywords section
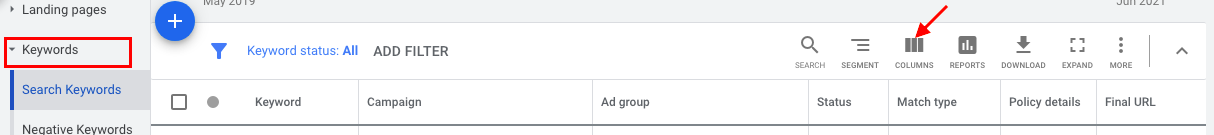
1. Select the Keywords section from the left menu and click the columns icon in the upper right corner of the table.
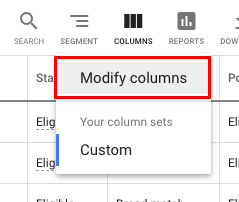
2. Open the Quality Score section under Modify columns.
3. From here, you can choose the current and past Quality Score and its component statuses. The historical Quality Score and its components are an average of past values.
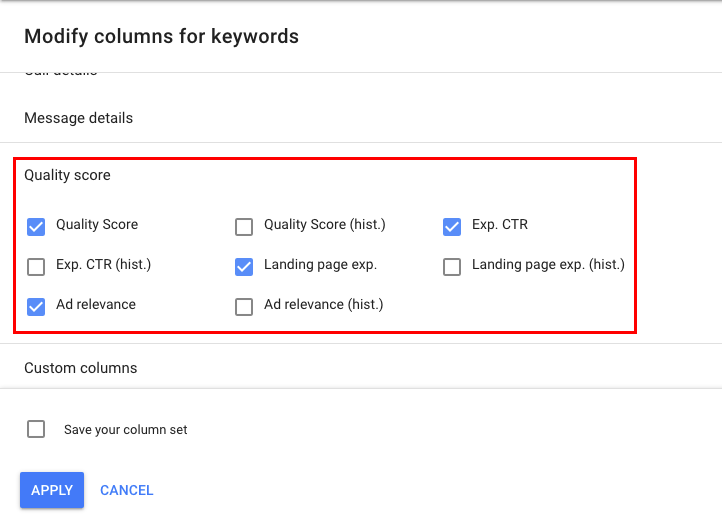
4. Click Apply to add columns to the table.
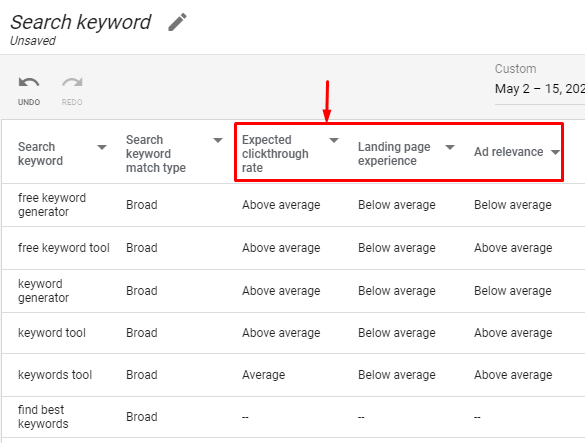
Here is an example of the Google Ads Quality Score report:
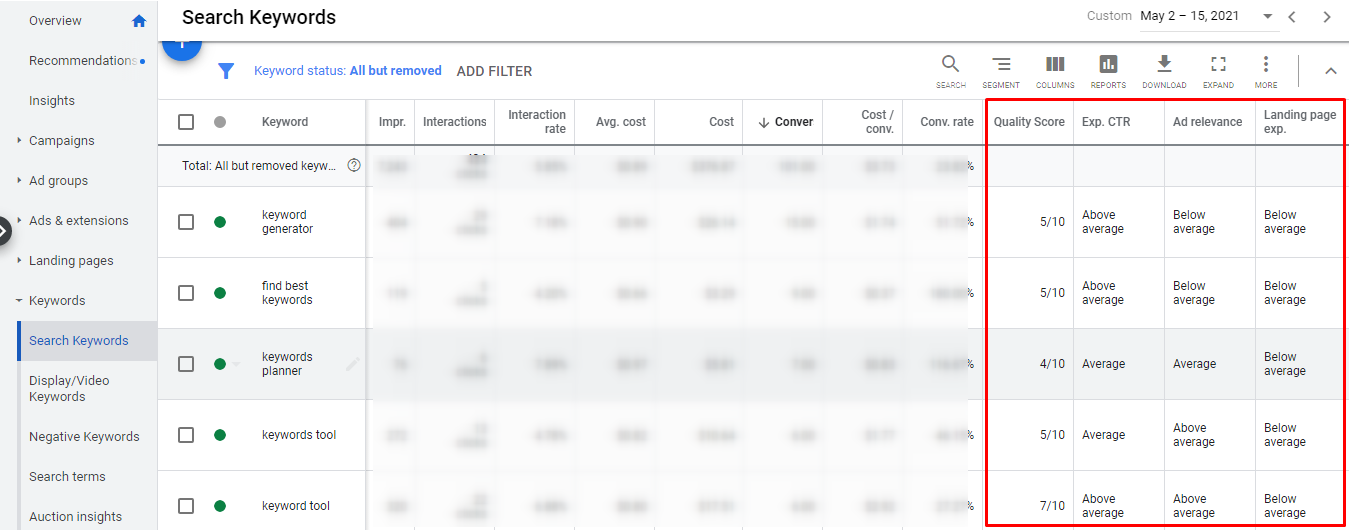
Often, you can see “—” in the Quality Score column. That means there isn’t enough data to determine a keyword’s Quality Score.
Creating Quality Score Report from the Reports
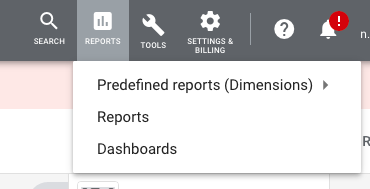
1. Go to the Reports section on the upper menu.
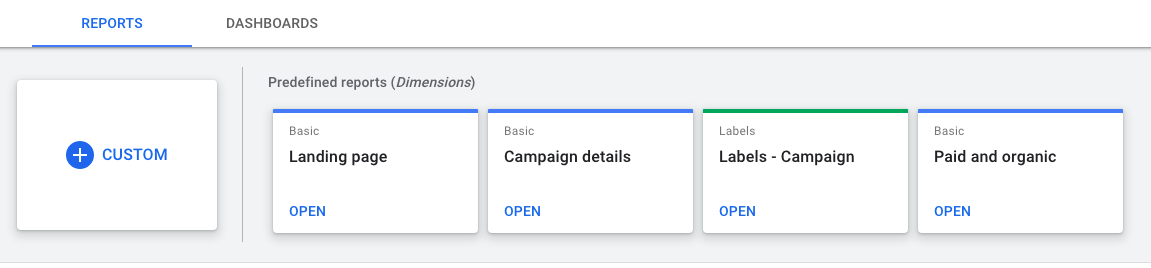
2. Choose Reports and select, for example, Campaign details, or create your custom report from scratch.
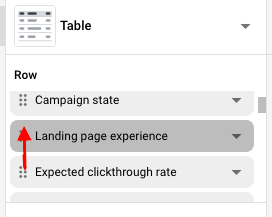
3. To add Quality Score components to the dashboard, choose them from the Metrics and Dimensions list on the right and drag and drop them to Rows.
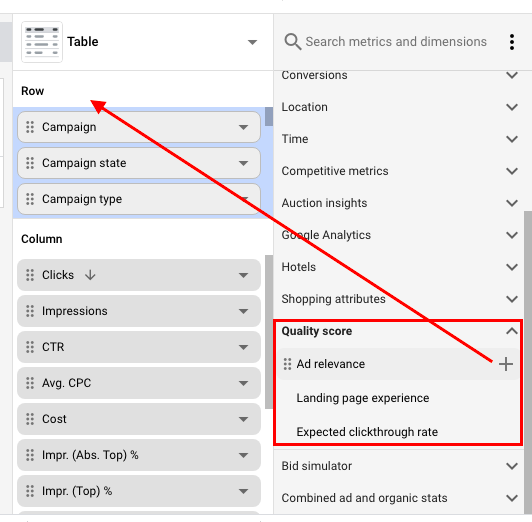
4. You can change the order of the metrics by dragging and dropping.
Here is a Quality Score report example:
PromoNavi Quality Score Report Template
Quality Score reports in Google Ads provide you with detailed data that help you optimize your campaigns on a keyword level. However, these reports lack aggregated data and visualization. Hence, when you prepare reports for your customers or managers, you need to waste time aggregating stats and creating charts.
The good news is that you can find data on Quality Score in PromoNavi’s Google Data Studio report.
This 16-page report includes such stats concerning Quality Score:
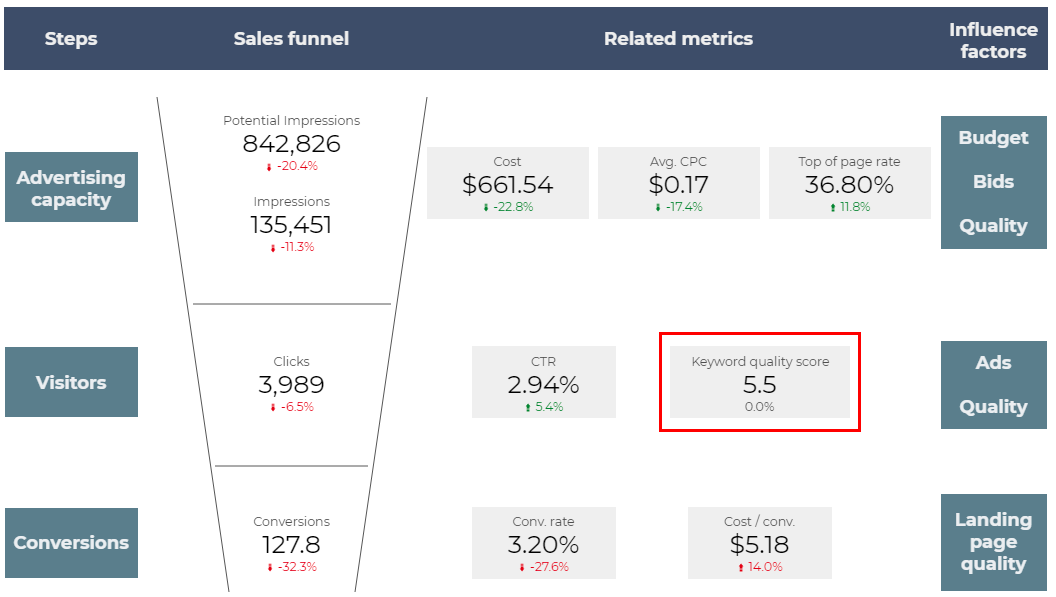
- The overall Keyword Quality Score on the Sales funnel page. This value gives you an understanding of whether your account needs in-depth optimization or not.
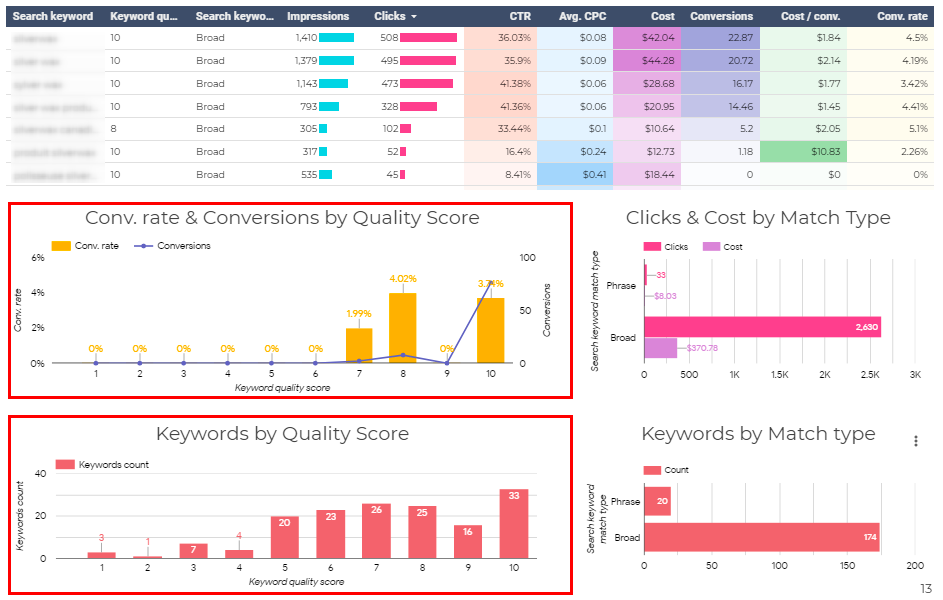
- The correlation between Quality Score and Conversion rate. You can see how Quality Score affects the Conversion Rate within your account and decide whether you need to increase your Quality Score.
- The keyword distribution by Quality Score. This data is helpful to understand the scopes of work needed to optimize your account.
Here is a video guide on how to start using PromoNavi GDS Report template:
You can find more GDS report templates from our post, “15 Best PPC Report Templates for Google Data Studio.”
How to Improve Quality Score Based on Report Data
To improve Google Ads Quality Score, you need to consider its components marked with a status “Average” or “Below average.” These are indicators that your account has headroom for improvements.
Improving the Quality Score component #1: Ad Relevance
- Split bigger campaigns and ad groups into smaller ones. A proper account structure can improve ad relevance.
- Group your keywords into themes based on your products, services, or other categories. For example, you can have a keyword group for “brown sunglasses” and another group of keywords for “black sunglasses,” if you sell sunglasses.
- Rewrite your ads to answer user’s questions in a better way. Try to change your call to action, headline, punctuation, and MVP (main value proposition).
- Include your top keywords in the ad copy (headline, ad text, display URL, if possible).
- Add negative keywords so your ads don’t appear to irrelevant searches.
Improving the Quality Score component #2: Expected Clickthrough Rate
- Rewrite your ad text to make your offer more compelling to your customers.
- Highlight unique benefits of your product or service, for example, free shipping.
- Experiment with calls to action; use words like Buy, Order, Find, Sell, Browse, Sign up, Try, Get a Quote.
- Incorporate Dynamic Keyword Insertion to make your ads more relevant to the search term.
Improving the Quality Score component #3: Landing Page Experience
- Create landing pages tailored for your ad groups.
- Make your landing page relevant, original, transparent, and navigable.
- Make your website mobile-friendly. Use Google’s Mobile-Friendly Test to see how well your landing page works on mobile devices.
- Improve landing page loading speed. You can do it by getting rid of excess JavaScript, reducing redirects, considering loading your page asynchronously, compressing images, and using a faster server.
- Make your page skimmable for busy customers.
- Eliminate excess form fields.
- Split test your landing page copy elements to find the best-performing ones.
Please note! Changes that affect ad relevance and the expected CTR can show results quite fast (approximately one week), but it might take weeks or months for landing page changes to reflect on your Quality Score.
Final Thoughts
Quality Score is a metric Google uses to measure the relevance of your keywords, ads, and landing pages to your audience. It provides you with valuable insights to identify ways to improve your ads, keywords, and landing pages.
Quality Score is not only a diagnostic tool; it also has an impact on ad impressions and Ad Rank. That is why it is essential to track your Quality Score and improve it. The best approach is to use Google Ads in-built reports alongside with PromoNavi’s GDS report template. In this case, you will have enough data to make tactical and strategic decisions and save time on aggregating your Quality Score stats.