Before we take a look at some reporting templates, let’s review the basics. Marketing reporting refers to the process of gathering, organizing, and interpreting marketing data and metrics with the purpose of enhancing the performance of your campaigns and strategies. Such reports are usually created by marketing agencies or the marketing team of a company.
A marketing report allows you to track progress and define the areas where you need to invest more time or marketing budget. Also, reporting provides insights into the performance of each channel and activity you are executing. Marketing reports help you make data-informed decisions regarding marketing strategies.
As you know, there are different types of reports, depending on the channel, marketing strategy, and time period. Here are some of the most common report types used for marketing campaigns:
- Annual marketing report
- Monthly marketing report
- Email marketing report
- SEO marketing report
- Content marketing report
- Digital marketing report
- PPC (pay-per-click) marketing report
- Traffic analytics report
- Lead generation report
What should a marketing report include?
Wondering what your marketing report should have to be insightful? Well, typically, a marketing report should include:
- Separate graphs for the most crucial aspects of your campaign.
- A set of the most informative metrics – as opposed to “vanity metrics” that look good but offer little meaning.
- A variety of visual elements – for example, different types of graphs for different metrics.
Depending on the type of report you are preparing (email marketing report, digital marketing report, yearly report, etc.), your final analysis will include different information and metrics. For instance, on a content marketing report, you will include details about bounce rate and organic traffic from Google Search Console, while on a PPC report, you will focus on cost per click and cost per acquisition.
Excel Marketing Reporting Template
Below we will discuss the two most popular reporting templates (Facebook Ads overview template and Google Ads overview template) for Excel to get started with your reporting even faster. As we all know, Excel is a powerful tool for data crunching. Once you have added the template with data, you can dig deeper into the data using formulas and other functions of Excel. It helps in making the analysis and provides a clear insight into your data.
Facebook Ads Overview Excel Template
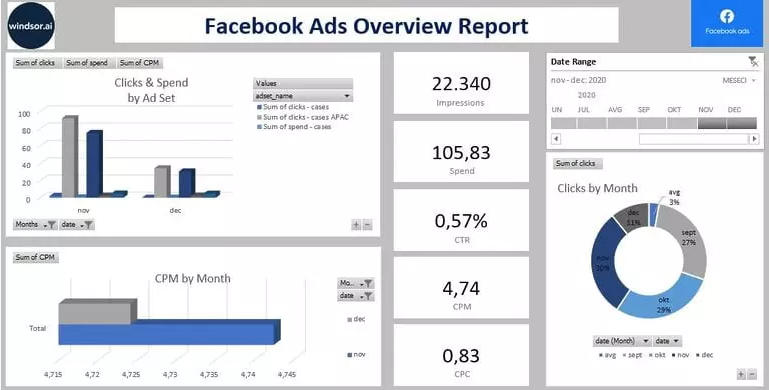 Picture was taken from the website https://windsor.ai/excel-facebook-ads-overview-report/
The Facebook Ads overview excel template provides an overview of your Facebook Ads account’s performance. You will find key numbers of your campaigns at the top of the report starting with clicks and conversions to cost and impression statistics. Just below it, there are trend lines to help you notice the development of the above metrics.
At the end of the report, you will find a pivot table that reflects the campaign’s performance over the last 30 days. An interactive map widget helps you identify which country the clicks on your ads are coming from.
If you want to dive even deeper and want to identify the performance of your campaigns on a given day, you may do that by heading over to the “Data” tab.
This Facebook Ads Overview Report template helps you to visualise your Facebook Ads into Excel in a few clicks. Dimensions and metrics visualised in this report are
- Source
- Campaign
- Adset Name
- Clicks
- Impressions
- Spend
- Cost per conversion
as well as added calculated fields like CPC, CMP, and CTR. There is a list of close to 300 metrics and dimensions available, once you start customising the report. To find the full list head to Available metrics and dimensions.
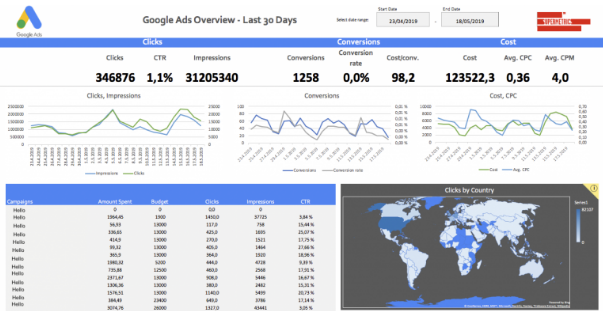
Google Ads Overview Excel template
 Picture was taken from the website https://supermetrics.com/blog/excel-marketing-templates#google_ads_overview_template
The Google Ads dashboard will act as a good resource for your or your clients’ accounts’ health check. You will easily see how the KPI’s perform over the previous 30-day period and their trend lines will provide you with the background information. In addition, a map breaking down clicks by country will help you identify the countries which bring you the biggest amount of traffic.
This template is perfect for agency marketers who want to get a good overview of their clients’ accounts or for professionals who want to understand how their Google Ads campaigns are running.
This template showcases various key metrics, including Impressions, Clicks, Cost per acquisition, Cost per click, Conversion rate, Amount Spent, and Total Conversions that provide you with details about your target audience. Also, you can calculate your Return on investment to see if your campaigns are profitable.
How to create a marketing report
There are a few things you need to take into account before getting started with your marketing reporting activity, including whether or not you should use a reporting tool. Let’s take a look at what you need to do to prepare an analysis that is both actionable and easy to understand.
1. Start with the purpose of the report: Ask yourself why you are creating this asset and how it is going to be used. Make sure you know exactly what you want to track and what your expectations are. This way, it is going to be easier to present it to others and create an action plan based on the report.
2. Track the right metrics: Yes, metrics are important, and I know you want to fill your report with metrics showing progress. However, you need to focus on the ones that are essential and show the current status of your marketing campaigns. For example, for a social media report, the number of Page likes is not necessarily an essential metric, since it’s more of a vanity one.
3. Gather and curate your data automatically: If you want to ensure that your data is up to date and correct, we recommend using a data automation solution that allows you to collect marketing data automatically and track changes in real-time.
4. Focus on data visualization: It’d be hard to make sense of hundreds of numbers popping out in a simple marketing report. That’s why it’s best to include graphs, charts, and other data visualization elements that can make your report understandable and shareable.
5. Use ready-to-use templates: If you want to create a great report, it doesn’t mean starting from scratch. There are hundreds of models and reporting templates you can use or get inspired by.
Final thoughts
Creating marketing reports is an important part of marketing efforts that will help you have a complete overview and increase the performance of your campaigns. There are various things that need to be considered before creating a marketing report, including what tools and templates to use.
Using reporting templates makes it simpler to create assets that are easy to understand and share with stakeholders. Templates come with key metrics you need to keep track of, as well as good design and data visualization elements, like graphs and pie charts, and are well worth looking into.