You probably know by now that you should be making data-driven decisions at work whenever possible. But do you know how to analyze the data available to you? The good news is that you most likely don’t need to do the number crunching yourself but you do need to understand and correctly interpret the analysis created by your colleagues. One of the most important types of data analyses is called regression analysis.
How does it work
Regression analysis is a set of statistical methods for the estimation of relationships between variables. It can be used to assess the degree of relationship between variables and to model future dependence. In fact, regression methods show how changes in the “independent variables” can fix the change in the “dependent variable”.
A dependent variable in business is called a predictor (a characteristic changes in which are being monitored). This can be the level of sales, risks, pricing, performance, etc.
Independent variables are those that can explain the behavior of the above factors (time of year, purchasing power of the population, place of sale, and much more).
Regression analysis includes several variations, such as linear, multiple linear, and nonlinear. The most common models are simple linear and multiple linear. Nonlinear regression analysis is commonly used for more complicated data sets in which the dependent and independent variables show a nonlinear relationship.
Assumptions of the linear model
Linear regression analysis is based on six fundamental assumptions:
- The dependent and independent variables show a linear relationship between the slope and the intercept.
- The independent variable is not random.
- The value of the residual (error) is zero.
- The value of the residual (error) is constant across all observations.
- The value of the residual (error) is not correlated across all observations.
- The residual (error) values follow the normal distribution.
Building a simple linear regression
A simple linear model is expressed using the following equation: Y = a + bX + ϵ
Where:
- Y – Dependent variable
- X – Independent (explanatory) variable
- a – Intercept
- b – Slope
- ϵ – Residual (error)
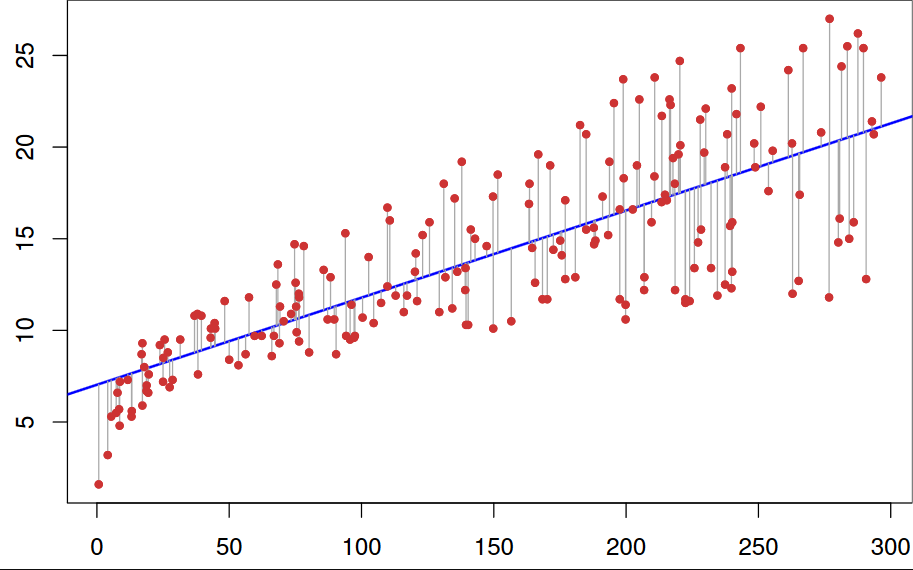 Picture was taken from the website https://numerary.readthedocs.io/ru/latest/linear-regression.html
Multiple Linear Regression
Multiple linear regression analysis is essentially similar to the simple linear model, with the exception that multiple independent variables are used in the model. The mathematical representation of multiple linear regression is:
Y = a + bX1 + cX2 + dX3 + ϵ
Where:
- Y – Dependent variable
- X1, X2, X3 – Independent (explanatory) variables
- a – Intercept
- b, c, d – Slopes
- ϵ – Residual (error)
Multiple linear regression follows the same conditions as the simple linear model. However, since there are several independent variables in multiple linear analysis, there is another mandatory condition for the model:
Non-collinearity: Independent variables should show a minimum correlation with each other. If the independent variables are highly correlated with each other, it will be difficult to assess the true relationships between the dependent and independent variables.
How companies use it
 Photo by Tima Miroshnichenko
Forecasting of indicators
This model can be used to detect trends and make forecasts. By conducting a linear analysis of monthly sales data, the company can predict sales in the months to come.
Evaluation of marketing efficiency
Linear regression can also be used to evaluate the effectiveness of marketing, advertising campaigns, and pricing. In order for a company to evaluate the qualitative return on the funds spent on marketing a certain brand, it is enough to plot a linear regression graph and see how costs are related to profit.
Linear regression allows you to capture the individual impacts of each marketing campaign, as well as to control the factors that may affect sales.
Risk assessment
The linear regression model works well for calculating risks in finance or insurance. For example, a car insurance company can build a linear regression to compile an insurance payout table using the ratio of forecasted claims to the claimed insurance value. The main factors in this situation are the characteristics of the car, driver data, or demographic information. The results will help in making important business decisions.
Detection of important factors
In the lending industry, a financial company is interested in minimizing risks. Therefore, it is important to understand the factors causing a client’s insolvency. Based on the results of a regression analysis, the company can identify these factors and determine the options for EMI (Equated Monthly Installment – a fixed payment made by the borrower to the lender within a specified period) in order to mitigate loan default risks.
Asset pricing
Another linear regression model finds its application in asset pricing. This helps investors evaluate the feasibility of investments and the profitability of their portfolio.
Avoiding common mistakes
 Photo by RDNE Stock project
As a consumer of regression analysis, you need to keep several things in mind.
Don’t tell your data analysts to figure out what is affecting sales. It’s your job to identify the factors that you suspect are having an impact and to ask your analyst to look at those.
Don’t ask your analysts to look at every variable they can possibly get their hands on at once. If you do, you’ll probably find relationships that don’t really exist. Moreover, always ask yourself what you will do with the data. What actions will you take? What decisions will you make?
Don’t let data replace your intuition. You always have to prioritize your intuition over the data. Ask yourself whether the results fit in with your understanding of the situation. And if you see something that doesn’t make sense, ask whether the data was right or whether there might be a large error term.
Analyses are very sensitive to bad data, so be careful about the data you collect and how you collect it, and make sure you can trust it.
Some managers who are new to regression analysis make the mistake of ignoring the error term. This is dangerous because they’re making the relationship between things more certain than it actually is. But remember that the results are always uncertain. The point of carrying out the analysis is to evaluate the chance of something happening.
Final thoughts
Despite the fact that linear regression has rather strict limitations since it can only work when the dependent variable is continuous and there is a linear relationship between the variables, the model is the most well-known method of analysis and forecasting. https://mostbet-games.net/uk/
We have cited the most popular ways of using this model in business and finance. Naturally, in order to really understand how to use it in your particular situation, you’ll need to dive into the details – to see how the model behaves on unique data, etc.