What is ROAS, and why is it so crucial for marketers and business owners? How does it relate to other metrics, and how to calculate it? What is good ROAS and how to improve it? How to estimate the target ROAS for your campaigns?
So many questions about ROAS, and you will find the answers in this article.
Keep on reading!
Quick Links
Why is ROAS Important for Your Business?
Where to Look For ROAS in Google Ads?
ROAS Stats and Benchmarks: What is a Good ROAS?
ROAS benchmarks across industries
What is a good ROAS for Google Ads?
What is a good ROAS for Facebook Ads?
How to Optimize Your Ads to Increase ROAS
What is ROAS?
ROAS stands for Return on Ad Spend. This marketing metric measures the amount of revenue your business receives for each dollar it spends on advertising. In other words, ROAS calculates the effectiveness of your advertising efforts: the better your messages connect with your potential clients, the more revenue you’ll earn from each dollar of ad spend.
Why is ROAS Important for Your Business?
ROAS is one of the best metrics that help businesses understand the performance of their ad campaigns or even ad groups and particular keywords.
ROAS answers the essential marketing question, «What will I earn if I put $X into this marketing channel or this particular ad campaign?» If a marketing channel isn’t paying profitable dividends, it isn’t worth the investment. If you realize that some campaigns outperform others, you may reallocate some budget to campaigns that are performing well.
How to Сalculate ROAS
You can measure ROAS at different levels: at the channel level (Google, Facebook, etc.), the campaign level, the ad group level, and so on.
ROAS equals your Total Ad Revenue divided by your advertising costs (Ad Spend):
ROAS = Total Ad Revenue / Total Ad Spend
Or, in Google Ads terms:
ROAS = Conversion value / Cost
Sometimes you’ll see the ROAS formula with percentages:
ROAS (%) = Total Ad Revenue / Total Ad Spend x 100%
An example of the ROAS calculation
For example, a company spends $10,000 on a campaign in a month. This month, the campaign earned $30,000. Therefore, the ROAS is 3 (or 300%). This means, for every dollar the company spends on this campaign, it gets $3 revenue.
ROAS = $30,000 : $10,000 = 3
ROAS (%) = $30,000 : $10,000 * 100% = 300%
If you spend more than you earn, your ROAS will be <1 (or <100%).
For example, if your ad spend is $5,000 and it brings $3,000, the ROAS will be 0,6 or 60%:
ROAS = $3,000 : $5,000 = 0,6
ROAS (%) = $3,000 : $5,000 * 100% = 60%.
In this case, the company receives only 60 cents of revenue for each dollar spent.
Keep in mind that Cost in the ROAS formula typically includes only the actual ad spend, not the total cost of your campaigns (ad copies creation, money paid to an agency, research, etc.).
ROAS and Conversion Lag
People need time to make a purchase decision. The more complex or pricier your product is, the more significant is the gap between when people click your ads and when they make their purchase. This gap is called conversion lag (or delay).
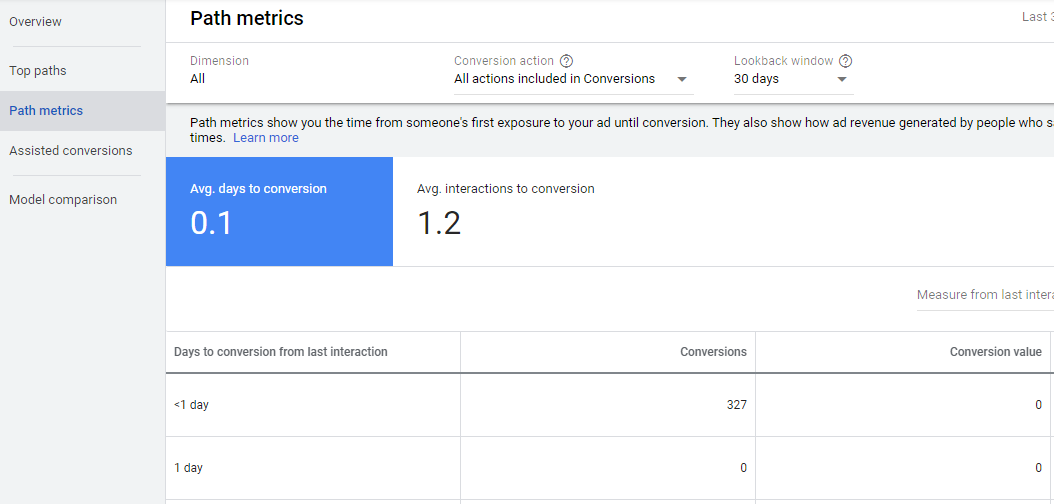
Why should you care about this delay concerning ROAS? You need to know your gap to make more accurate ROAS forecasts and evaluate your metrics because ROAS after 3, 14, and 30 days may differ significantly.
To check your account’s conversion delay, go to the Tools & Settings menu in your account, select the Attribution section. Now, click Path metrics. From this table, you can discover how many days it takes for your customers to buy from their most recent ad click.
ROAS and Other Metrics
Let’s discuss how ROAS differs from the other PPC KPIs.
ROAS vs. ROI
In many ways, ROAS is similar to another vital marketing metric, ROI (Return on Investment). However, ROI is a business-centric metric; ROAS, on the other hand, focuses on particular advertising campaigns, groups, or even keywords.
| ROAS | ROI |
|---|---|
| ROAS = Total Ad Revenue / Total Ad Spend | ROI = Net Profit / Total Investment*100 |
| Ad-centric metric | Business-centric metric |
| Short-term metric | Long-term metric |
| Evaluates the effectiveness of ad campaigns, groups, and keywords | Evaluates the effectiveness of all marketing efforts |
ROAS vs. CPC
No doubt, Click metrics are important, but you shouldn’t evaluate your campaign’s performance based on them. High CTR and low CPC don’t always relate to high-quality traffic. Let’s take a look at this dataset:
It looks like Campaign 3 has much better results than Campaign 2, but it’s not enough to make conclusions based on this data.
Let’s add two more columns—revenue and ROAS:
Now, you can see that Campaign 2 is much more profitable for the business than Campaign 3, although its click metrics are better.
ROAS vs. CPA
A widely used metric determining the success of a PPC campaign is Cost per conversion (CPA). It is definitely helpful, but it is also quite limited; it only measures the average cost associated with a single action.
Let’s take a look at two ad groups:
Based on the CPA, Ad Group 2 is a clear winner. But if we add Revenue and ROAS columns, the picture will change:
Now we see that Ad Group 2 has a ROAS of 0.6 (or 60%)—meaning the cost of advertising did not pay off. And the more expensive Ad Group 2 has a much higher ROAS of 4.2 (or 420%). Now the winner has changed.
Where to Look For ROAS in Google Ads?
In Google Ads, there is no special ROAS column, but this metric is presented as “Conversion Value / Cost.”
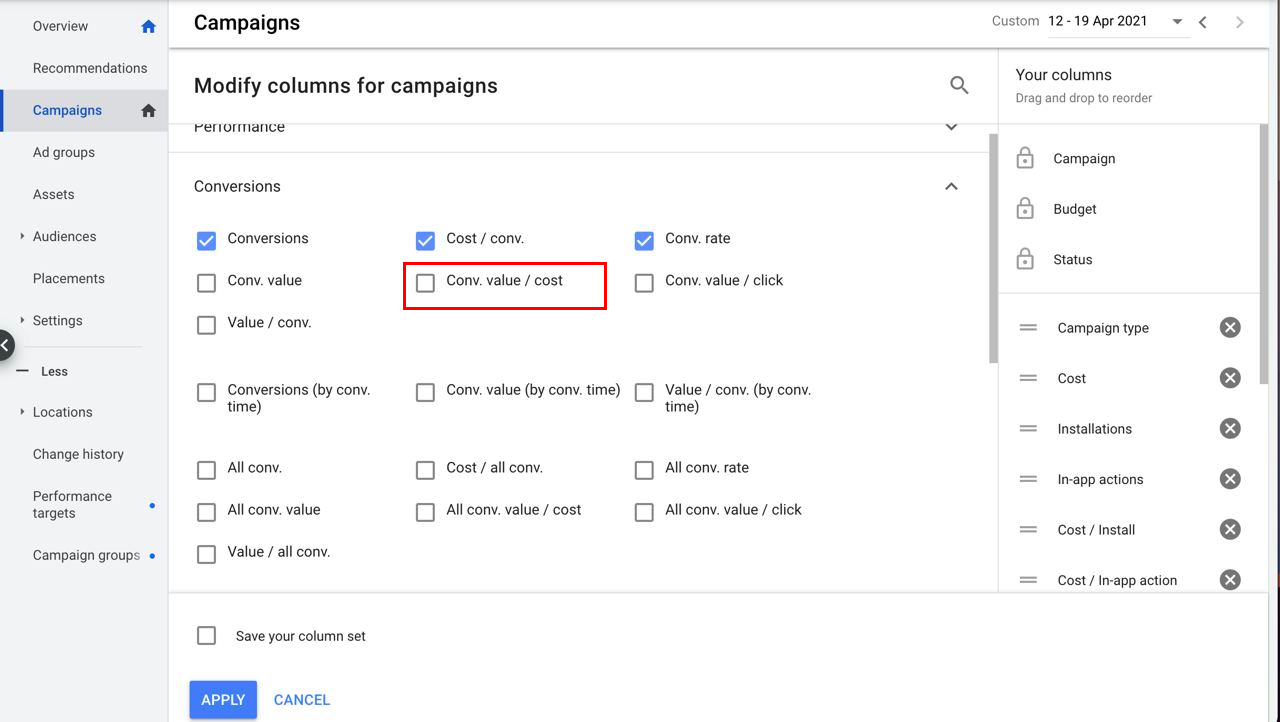 Add Conv. value/cost column to know your ROAS.
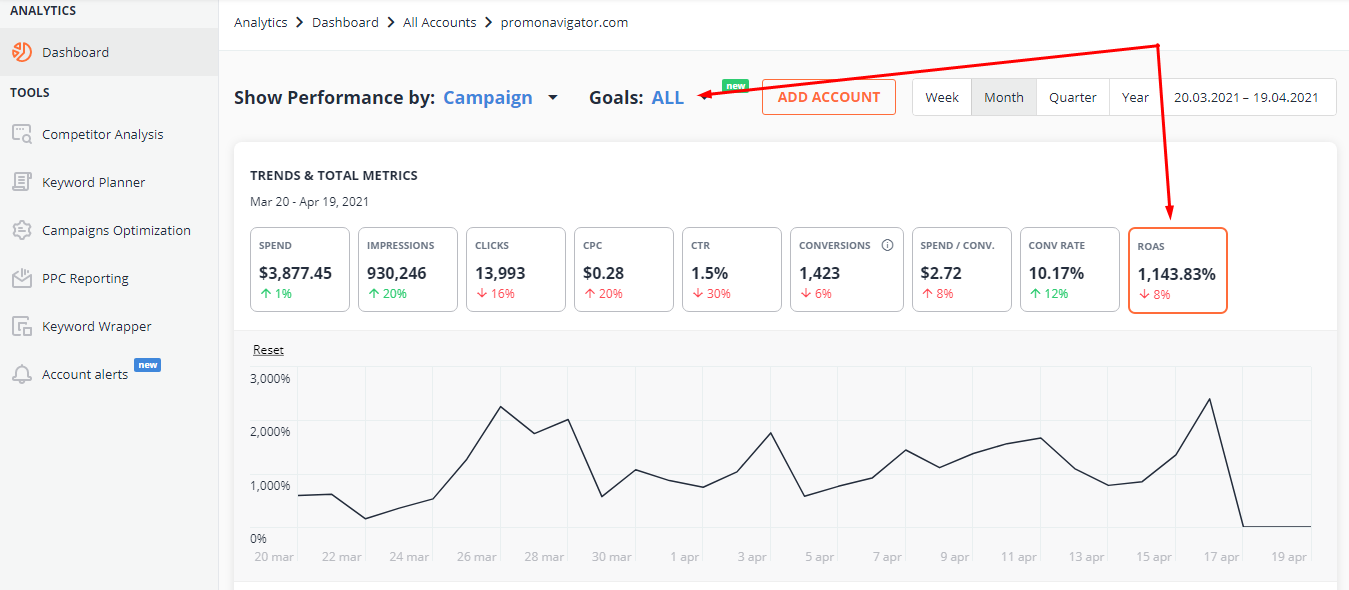
Unlike Google Ads, on PromoNavi Analytics Dashboard, you can find a ROAS column. If you click on ROAS, you’ll see a chart for this metric.
Moreover, from this dashboard, you can analyze your ROAS across specific goals. For example, you can see a ROAS for users who registered on your site or made a purchase.
ROAS Stats and Benchmarks: What is a Good ROAS?
While there’s no correct answer for every industry, business, advertising channel, or campaign, a standard ROAS benchmark you may take into account is 200% or a 2:1 ratio: $2 revenue to $1 in ad spend.
However, the numbers can vary depending on many factors, but make sure that your ROAS is >1 or over 100%; otherwise, it means you spend on advertising more than you earn.
ROAS benchmarks across industries
Unfortunately, it is challenging to find any recent benchmarks for ROAS across industries. The problem is that most companies don’t share their ad cost and revenue data. Therefore, conclusions made on small samples are not objective.
The most comprehensive study has been provided by Nielsen. According to it, the average ROAS across most industries hovers around 287%.
Here are some ROAS insights across particular industries:
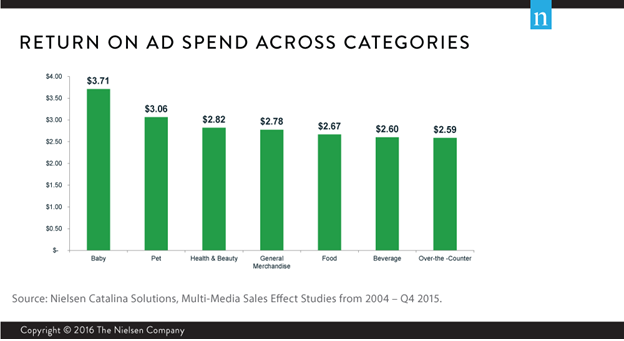 Image Source: www.nielsen.com
What is a good ROAS for Google Ads?
According to Google Ads, the average ROAS for Google paid campaigns is 200%. For Google Search Network, that amount increases up to 800%—meaning that Display advertising allows you to drive more revenue.
How to Save Your Google Ads Budget [4 Fully Automated Tools]
What is a good ROAS for Facebook Ads?
According to recent Wolfgang Digital’s “KPI Report 2020,” ROAS on Facebook Ads vary depending on the placements.
 Image source: www.wolfgangdigital.com
Here are the ROAS values across Facebook Ads placements:
- Facebook Feed—7.83
- Facebook Messenger—7.23
- Facebook Marketplace—6.46
- Instagram Feed—3.16
- Instagram Stories—1.32
The key takeaway is that placing ads on Facebook gives you much more ROAS than on Instagram.
ROAS benchmarks across media
According to NCS’s research, ROAS across marketing channels varies more than twice. The most profitable channels are magazines, Display ads, and Cross Media. Digital Video performs not so well, as other channels. Anyway, the ROAS value range of 1.53-3.94 gives us an understanding of the average numbers across channels.
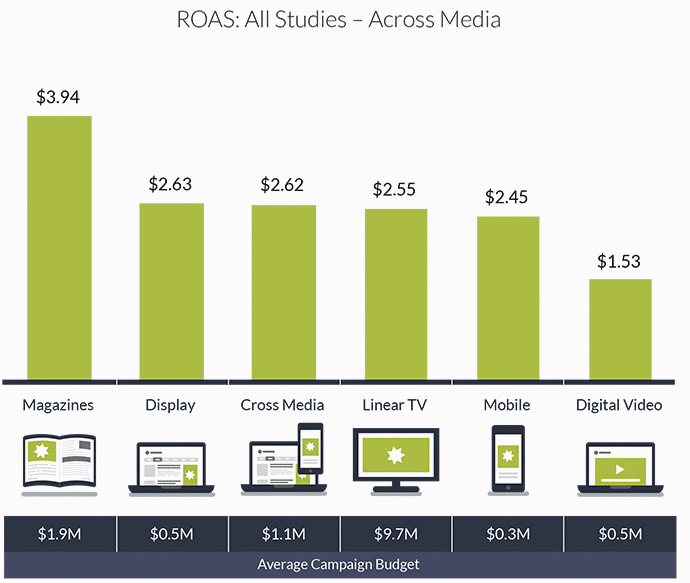 Image Source: www.ncsolutions.com
How to Optimize Your Ads to Increase ROAS
Here are some ideas on how you can optimize campaigns to increase ROAS.
- Use MaximizeConversionValue.target_roas option. Since April 2021, Google Ads reorganizes its Smart Bidding strategies. MaximizeConversionValue.target_roas will act identically to Target Roas (tROAS) bid strategy.
- Avoid common mistakes when shifting from manual to Smart bidding. For example, your account can have not enough conversions, or you’re using the Last-Click attribution model, or you’ve created too granular ad groups, etc. If you want to skyrocket your ROAS when using Smart bidding, read our guide on how to make the most of Google’s Smart strategies.
- Define your target audience. Funnel your budget to an audience that is most likely to convert and spend more money.
- Use hyper-local marketing techniques for products that are connected to specific locations. Also, you should avoid common mistakes when setting up geo-targeting.
- Experiment with platforms. For example, for a younger audience, TikTok and Snapchat can have a higher ROAS than Facebook; LinkedIn would be a better choice for B2B.
- Target for a mobile audience to target those who want to make a quick decision.
- Use long-tail keywords. General keywords have larger search volumes, but you can waste a lot of money on low-quality traffic if you bid on those. Here are 7 ways to find effective keywords for your campaigns.
- Refine your negative keyword list. Exclude keywords with low ROAS. PromoNavi’s Add Negative Keywords tool allows you to find such underperforming keywords and add them to your negative keyword list in one-click.
- Create branded PPC campaigns. Campaigns targeting your company’s name can help you get more conversions because users are already interested in your brand.
- Use remarketing audiences. These prospects are also more interested than the cold audience.
- Create Shopping campaigns to target clients who want to make a purchase.
- Improve your Quality Score. A better Quality Score can result in a higher ad ranking and lower CPC.
- Run A/B tests to find ads that are generating the best results.
- Optimize your landing pages. Sometimes a low ROAS is not a sign of a bad campaign. If you have many clicks but few conversions, the problem can be with the UX, speed, product price, weak calls to action, etc. Optimize your landing pages, and you will increase your ROAS.
Boost your ROAS! Link your PPC accounts to PromoNavi to automate everyday tasks and receive valuable recommendations on how to improve your campaigns.
With PromoNavi, you can do keyword research, competitor analysis, automate reporting, track your PPC performance on the Analytics Dashboard, and get profitable PPC optimization recommendations.
