Navigating the overwhelming number of metrics in Google Ads can be a daunting task for beginners. Even seasoned PPC professionals are often missing opportunities by not sorting their columns logically. In this post, we will dive into how to sort your columns logically to get additional insights.
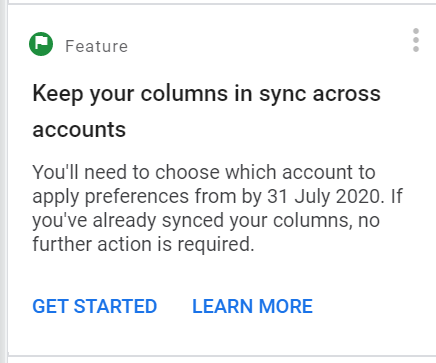
Google has been focussing a lot lately on Cross-Account management, with many added possibilities to sync data across accounts (such as shared budgets, cross-account reports, etc.) One of those recently added features is sharing your metric configurations across accounts, an incredibly useful feature that is underappreciated by the community.
Many advertisers have learned to deal with the illogical default configurations. You need to scroll to see conversions, but irrelevant (vanity) metrics like impressions are listed in the front of the metric list.
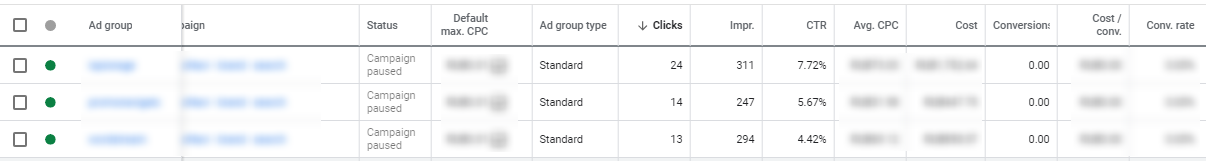 The default columns in the Ad groups section
Some super important metrics like ROAS are simply missing in the default setup. So, we introduce the alternative columns sorting. It would be more informative for understanding your Google Ads performance change.
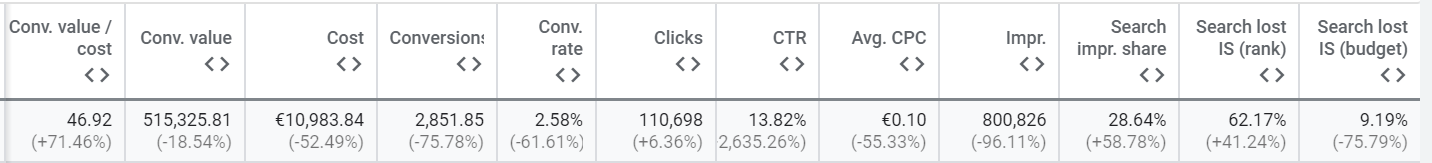 The alternative columns sorting
Why is this sorting better than the default one? We’ll explain step-by-step.
Let’s evaluate why performance changed
Many factors the Google Ads account performance: keywords, bids, competition, Search partners, tracking issues, landing pages, match types, etc. To diagnose the issue causing performance changes, we should simplify and isolate specific sub-processes going on in the account. We can do this by using a so-called “Top-Down Analysis.“
There are many steps that a potential client goes through before they bring revenue to the advertiser. With a top-down analysis, we reverse engineer this process to find improvement potential. We find that before we get revenue, the client goes through the following stages:
- A Search Query is made, which may or may not generate an impression
- An Impression is generated, which may or may not be clicked
- An Ad is clicked, which may or may not result in a conversion
- A Conversion is made, which may or may not be profitable for the advertiser
What metrics matter the most? Our sales and profit!
The vast majority of advertisers care about the Sales versus the Costs (your Return on Ad Spend, or ROAS.) As the ROAS is the first metric to look for, move it to the front of your column list.
ROAS can be caused by either the Revenue (Conversion Value) or the Ad Spent (Costs,) so those are the next metrics we want to add. We can then already make our first observations and add three metrics:
- ROAS (Conversion Value / Cost)
- Cost
- Conversion Value
While a decreased ROAS is generally a bad sign, we may find from these metrics combined that the costs increased significantly. It may be more profitable to set a lower ROAS target if the increase in volume makes up for the loss. Our profit may be larger. Even when all top metrics have improved, it’s wise to complete the analysis and dive further as there may be some elements of your campaign that can be further improved.
The costs are straightforward and can be influenced by adjusting our daily budget. However, revenue can be explored deeper. This brings us to the next step.
Maybe our revenue is up because we’ve got more conversions? Let’s evaluate
Now, we start to explore the root cause of the Revenue change, the Conversions. Let’s update our table with two more metrics:
- Conversions
- Conversion rate
Here we want to evaluate the change in the Conversions next to the relative change in Conversion Value. If both are equal (for example, both increased by 10%), we can move to the next analysis level. However, we may see differences as well.
We may see that the revenue increased less than the conversions. This may indicate that the value of conversions decreased. We may need to change our bidding from target CPA to target ROAS to consider the revenue value of products.
We also may need to review if our conversion tracking is still working properly, or if micro conversions are disrupting rather than helping to achieve the goals. We may also need to look outside of Google Ads and see if there were any changes to landing pages that could explain the change in conversion rates.
If we don’t find any issues with the conversions, we can move to the next level.
Maybe we sold more because people just clicked more?
The root of conversions is traffic. Without clicks, we won’t be able to drive conversions. So, we add four more metrics:
- Clicks
- Avg. Position
- CTR
- CPC
Firstly, we want to compare the relative change in clicks, with the relative change in conversions.
Your position metrics go hand in hand with your CPC and CTR (increased ranks mean a higher CPC and higher CTR.)
If your position stayed the same, but your CTR changed, you should most likely be looking at your ad copy. Your ad copy is the primary CTR driver.
If your CPC changed a lot, you probably should be looking at your keywords or your competitors. For higher positions, you will pay a higher CPC, and if the market becomes more competitive, these competitors also drive up the click prices.
We arrived at the root cause! Impressions… We won’t get very far if our ads don’t show
Similar to how clicks generate conversions, impressions drive clicks. If we want to explain a rise in the number of clicks, we should look at the root cause of clicks and impressions.
The last three metrics in our table are:
- Impressions
- Search Impression Share
- Search Query Volume
As usual, we start by comparing the relative rise or decrease in impressions with the clicks. The sub-metrics we want to review on this level are the Search Impression Share and Search Query Volumes. We want to compare our actual impressions with the impressions that we could have gotten.
It’s essential to understand the Impression Share change in relation to the total traffic. That will help us understand the growth potential for active keywords. In case we are not getting 100% of our Impression Share, we should know if we are limited by budget or by rank.
In case we are limited by budget, we should look at increasing our budget or reduce our costs. In case the search queries increased, we may have spotted a trending query, or in seasonal businesses, it can indicate the start of high season. In case we are more limited by rank under the same costs, we should take a look at our competitors.
Variations for column sorting in eCommerce, Lead Gen or Branding
The mentioned column order of starting with ROAS and costs, then Conversion value and Conversions, and working down to Clicks and Impressions is a relevant order for both eCommerce and Lead generation (Conversion Value columns may be omitted in lead gen.)
A similar mindset could be followed when setting up a branding campaign. First, starting with the top goal (such as Click Share,) determining what the metric is caused by (CTR, Impression Share,) and working down to explore the root causes (Clicks, Impressions, etc.)
Conclusion
Logically sorting our columns, we’ll uncover why performance changed. This is one of the best ways to analyze why the performance of a Google Ads account changed over time. It helps both to spot issues that have caused a decrease in performance but as well to spot opportunities to double down on.
In Google’s recent updates, it’s easier than ever to save and share column setups across accounts or create separate column setups per account type. It’s a feature you should use.
So are you ready to start understanding your account? Then let’s get sorting!